Takyon Networks wins Rs 178.61 lakh work order from Northern Railway

scanx
Reviewed by
Ritika DScanX News Team
Key Highlights
  • Takyon Networks secured a confirmed work order of Rs 178.61 lakh from Northern Railway for CMS connectivity upgrades.
  • The order has an execution timeline of 180 days and adds to the company's existing backlog.
  • Recent order inflow in Q2FY27 totaled Rs 405.06 crore, primarily from defense and education sectors.
  • Annual revenue declined by 31.4% in FY26, and OPM compressed to 7.53%, highlighting execution challenges.
  • Balance sheet remains strong with a current ratio of 4.58x and low leverage (Total Liabilities/Equity of 0.21x).
powered bylight_fuzz_icon
50510070

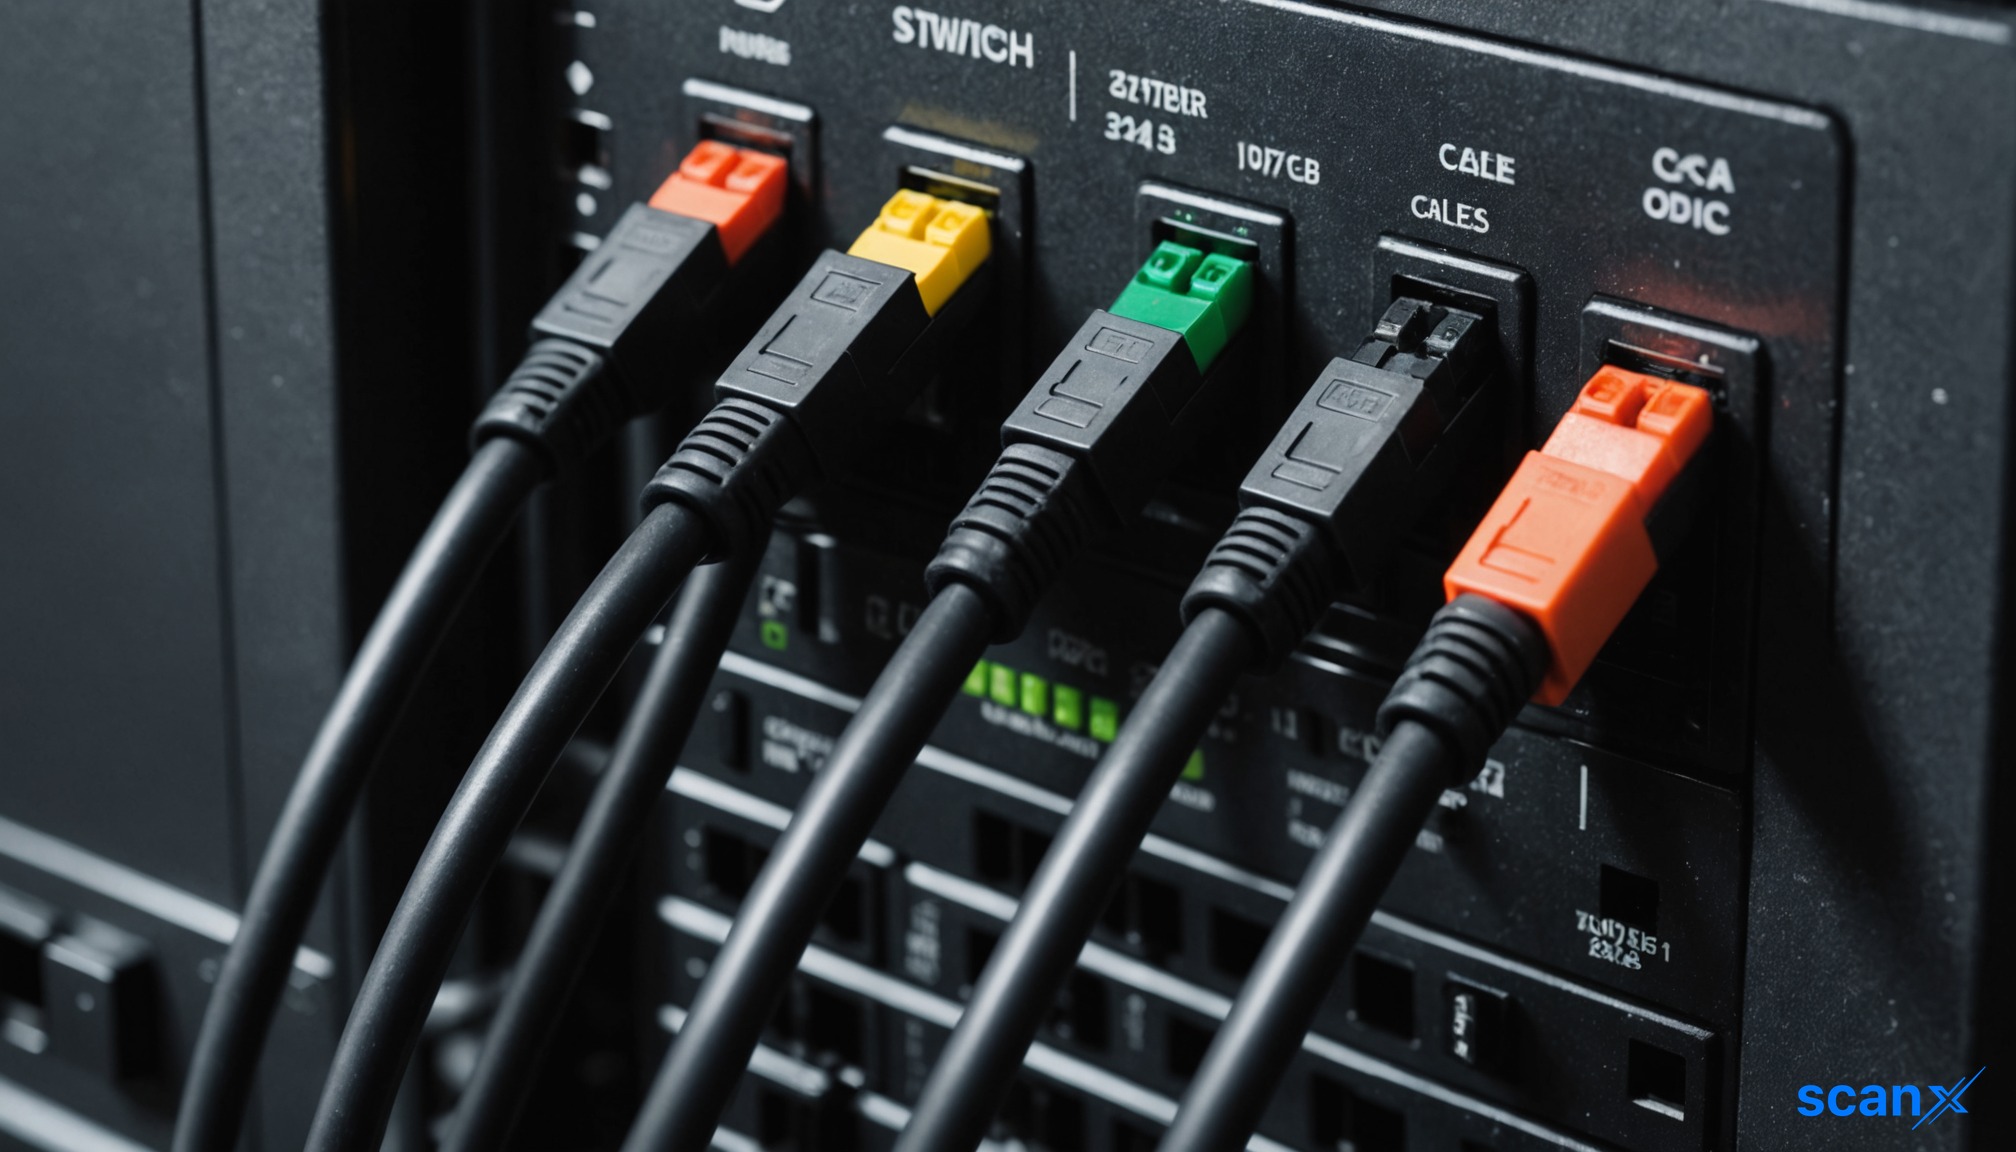
*this image is generated using AI for illustrative purposes only.

WHAT HAPPENED

Takyon Networks has won a confirmed work order valued at Rs 178.61 lakh from Northern Railway, Lucknow. The contract covers the augmentation and upgradation of Last Mile Connectivity of Command and Control Systems (CMS) at various stations across the Lucknow Division. The execution timeline is set at 180 days from the award date.

ORDER IN FINANCIAL CONTEXT

The Rs 178.61 lakh order represents a modest addition to the company's revenue pipeline. Given that the average quarterly revenue is not explicitly provided as a single pre-computed figure in the input context for direct division, we look to the annual scale: FY26 revenue was Rs 71.05 crore, implying an average quarterly run-rate of approximately Rs 17.76 crore. This order is roughly 1% of that quarterly average.

The total disclosed order book sums exactly the same last 3 fiscal quarters shown in the order track record table below (sum of the 2 orders disclosed across the last 3 fiscal quarters shown in the table below). With only two prior orders disclosed in the recent window totaling Rs 405.06 crore, the backlog coverage is limited. The book-to-bill ratio cannot be precisely calculated using standard TTM metrics due to zero TTM revenue reported in the trailing twelve-month P&L snapshot, highlighting a potential gap between recent order wins and recognized revenue.

COMPANY ORDER TRACK RECORD

Order inflow velocity appears stable but concentrated in larger deals recently. The current order value of Rs 178.61 lakh is consistent with the lower end of the company's typical per-order size visible in the history, which ranged from Rs 143.2 lakh to Rs 261.86 lakh in Q2FY27.

Quarter Total Order Inflow (Rs Cr) Key Awarding Entities
Q2FY27 (Jul-Sep 2026) 405.06 Hindustan Aeronautics Limited, Indian Institute of Information Technology, Allahabad

EXECUTION AND REVENUE QUALITY

The company's financial performance shows signs of stress in the latest fiscal year. Revenue declined significantly, and operating margins compressed.

Quarter Revenue (Rs Cr) Net Profit (Rs Cr) OPM (%)
FY26 Annual 71.05 3.67 7.53%
FY25 Annual 103.50 7.00 12.05%
FY24 Annual 108.20 5.20 9.63%

Note: Quarterly consolidated data was not available in the input; annual figures are used above to show trend.

The existing backlog conversion to revenue has slowed, as evidenced by the drop in OPM from 12.05% in FY25 to 7.53% in FY26. No quarters showed net losses, but the profit decline signals execution or pricing pressure.

REVENUE GROWTH - ORDER WINS TRANSLATING TO REVENUE

As Takyon Networks has sustained order wins, with significant inflows recorded in Q2FY27, its annual revenue has declined from Rs 103.50 crore in FY25 to Rs 71.05 crore in FY26, representing a YoY growth of -31.4% based on the latest annual data. This disconnect suggests that recent order wins have not yet translated into top-line growth, possibly due to timing mismatches in revenue recognition or delays in project execution.

WORKING CAPITAL AND EXECUTION CAPACITY

The balance sheet remains robust, providing ample liquidity to execute new contracts. The current ratio stands at 4.58x, indicating strong short-term solvency. Total Liabilities/Equity is low at 0.21x, reflecting minimal leverage. Operating cashflow was positive at Rs 7.80 crore in FY25, suggesting that past backlogs have converted to cash efficiently. However, the negative free cashflow in FY23 (-Rs 14.50 crore) highlights historical volatility in cash conversion cycles.

WHAT TO WATCH

  • Execution rate: Monitor if the Rs 178.61 lakh order contributes meaningfully to reversing the -31.4% revenue decline seen in FY26.
  • Margin quality: Watch for stabilization of OPM, which dropped from 12.05% to 7.53% in the last fiscal year.
  • Client concentration: Assess if reliance on specific government entities like Northern Railway creates payment cycle risks.
  • Backlog visibility: With limited disclosed orders in the recent window, future order inflow consistency is key.

KEY OBSERVATIONS

  • Revenue decline: Annual revenue fell by 31.4% in FY26 to Rs 71.05 crore, despite order wins in subsequent quarters, indicating a lag in revenue recognition.
  • Margin compression: Operating Profit Margin (OPM) decreased from 12.05% in FY25 to 7.53% in FY26, signaling potential cost pressures or lower-margin projects.
  • Strong liquidity: Current ratio of 4.58x provides a comfortable buffer for working capital needs associated with new orders.

Historical Stock Returns for Takyon Networks

1 Day5 Days1 Month6 Months1 Year5 Years
+3.66%+0.06%-9.30%-45.03%-66.47%0.0%

Takyon Networks wins Rs 143.2 lakh order from Hindustan Aeronautics Limited

scanx
Reviewed by
Ritika DScanX News Team
Key Highlights

Takyon Networks wins a confirmed Rs 143.2 lakh order from Hal for IT network upgrades. While order inflows are accelerating, annual revenue declined 31.4% in FY26. Strong liquidity (Current Ratio 4.58x) supports execution, but margin compression warrants monitoring.

powered bylight_fuzz_icon
46694121

*this image is generated using AI for illustrative purposes only.

WHAT HAPPENED

Takyon Networks has received a confirmed work order valued at Rs 143.2 lakh from Hindustan Aeronautics Limited (Hal) for the upgrade of its IT network. The contract specifies an execution timeline of 120 days, classifying this as a firm, executable order rather than a pre-qualification or mobilisation notice. The filing was disclosed to the exchange on July 24, 2026.

ORDER IN FINANCIAL CONTEXT

The Rs 143.2 lakh order represents a modest addition to the company's near-term revenue pipeline. With average quarterly revenue at Rs 0.0 crore based on trailing twelve-month data, the order value is significant relative to recent reported earnings, though TTM revenue figures appear to be zero or not yet updated for the current fiscal period. The total disclosed order book sums exactly the same last 3 fiscal quarters shown in the order track record table below (sum of the 6 orders disclosed across the last 3 fiscal quarters shown in the table below), providing a clear view of recent inflow velocity. The book-to-bill ratio cannot be precisely calculated using the provided pre-computed metrics as average quarterly revenue is listed as 0.0 Cr, but the absolute order inflow of Rs 261.86 crore in Q2FY27 and Rs 148.62 crore in Q1FY27 suggests a substantial backlog relative to historical annual revenue levels.

COMPANY ORDER TRACK RECORD

Order inflow velocity has accelerated significantly in the most recent quarter. Q2FY27 saw a single large order inflow of Rs 261.86 crore, up from Rs 148.62 crore spread across five orders in Q1FY27. This current order from Hal is consistent with the company's typical per-order size visible in the history, which ranges from small-value IT upgrades to larger infrastructure contracts.

Quarter: Total Order Inflow (Rs Cr): Key Awarding Entities:
Q2FY27 (Jul-Sep 2026) 261.86 Indian Institute of Information Technology, Allahabad
Q1FY27 (Apr-Jun 2026) 148.62 Hal, Agra Division-S And T Drm Office, North Central Railway Agra, Uttar Pradesh, India, Hal Kanpur, Research Designs & Standards Organisation (Rdso) Manaknagar Lucknow 226011, Skynet Services Global Private Limited

EXECUTION AND REVENUE QUALITY

The company's revenue and profit metrics show a declining trend over the past three years. Net profit fell by 47.6% year-on-year in FY26, and operating profit margin (OPM) compressed to 7.53% from 12.05% in FY25. There are no net losses in the quarterly data provided, but the contraction in margins signals execution pressure or a shift towards lower-margin projects.

Quarter: Revenue (Rs Cr): Net Profit (Rs Cr): OPM (%):
FY26 71.05 3.67 7.53%
FY25 103.50 7.00 12.05%
FY24 108.20 5.20 9.63%

REVENUE GROWTH - ORDER WINS TRANSLATING TO REVENUE

As Takyon Networks has sustained order wins, with inflows accelerating in recent quarters, its annual revenue has declined from Rs 103.50 crore in FY25 to Rs 71.05 crore in FY26, representing a YoY growth of -31.4% based on the latest annual data. This disconnect between recent order inflows and reported revenue suggests that either the backlog conversion cycle is lengthening or the nature of recent orders differs from those driving past revenue.

WORKING CAPITAL AND EXECUTION CAPACITY

The balance sheet indicates strong liquidity to support execution. The current ratio stands at 4.58x, well above the 1.2x threshold, indicating ample short-term assets to cover liabilities. Total Liabilities/Equity is low at 0.21x, reflecting a conservative capital structure with minimal reliance on debt. Operating cashflow was positive at Rs 7.80 crore in FY25, suggesting that past backlogs have converted to cash efficiently, although this needs to be monitored against the current revenue decline.

WHAT TO WATCH

  • Execution rate: Monitor whether the large Q2FY27 order inflow translates into revenue recognition in upcoming quarters, given the recent decline in annual revenue.
  • OPM trajectory: Watch if the new IT network upgrade order maintains or improves the compressed 7.53% OPM seen in FY26.
  • Client concentration: Hal appears frequently in the order history; assess if reliance on defense/public sector clients introduces payment cycle risks.
  • Revenue visibility: Given the zero TTM revenue figure, clarity on when the current backlog will hit the P&L is critical for investors.

KEY OBSERVATIONS

  • Valuation check (as of 27 Jul 2026): P/E of 7.6x against ROCE of 31.38%. At the time of this article, valuation was pricing in execution improvement not yet visible in return ratios. (P/E is price-derived and will change; ROCE is from audited financials)
  • Margin stress: Operating profit margin compressed to 7.53% in FY26 from 12.05% in FY25, indicating potential pricing pressure or higher input costs.
  • Liquidity strength: Current ratio of 4.58x provides significant buffer for working capital requirements associated with the new order backlog.

Historical Stock Returns for Takyon Networks

1 Day5 Days1 Month6 Months1 Year5 Years
+3.66%+0.06%-9.30%-45.03%-66.47%0.0%

More News on Takyon Networks

1 Year Returns:-66.47%