

Sweetgreen Q2FY26 Results: Comparable sales fall 6.2%, EBITDA loss $0.2 million


- Revenue rose 4% YoY to $192.7 million, but comparable sales fell 6.2%
- Adjusted EBITDA swung to a $0.2 million loss from a $6.4 million profit
- Restaurant-level margin contracted to 13.1% from 18.9% in the prior year
- Wraps achieved 20% sales incidence, driving Gen Z engagement and frequency
- Full-year guidance revised for Cyclospora impact, expecting 8-7% comp decline

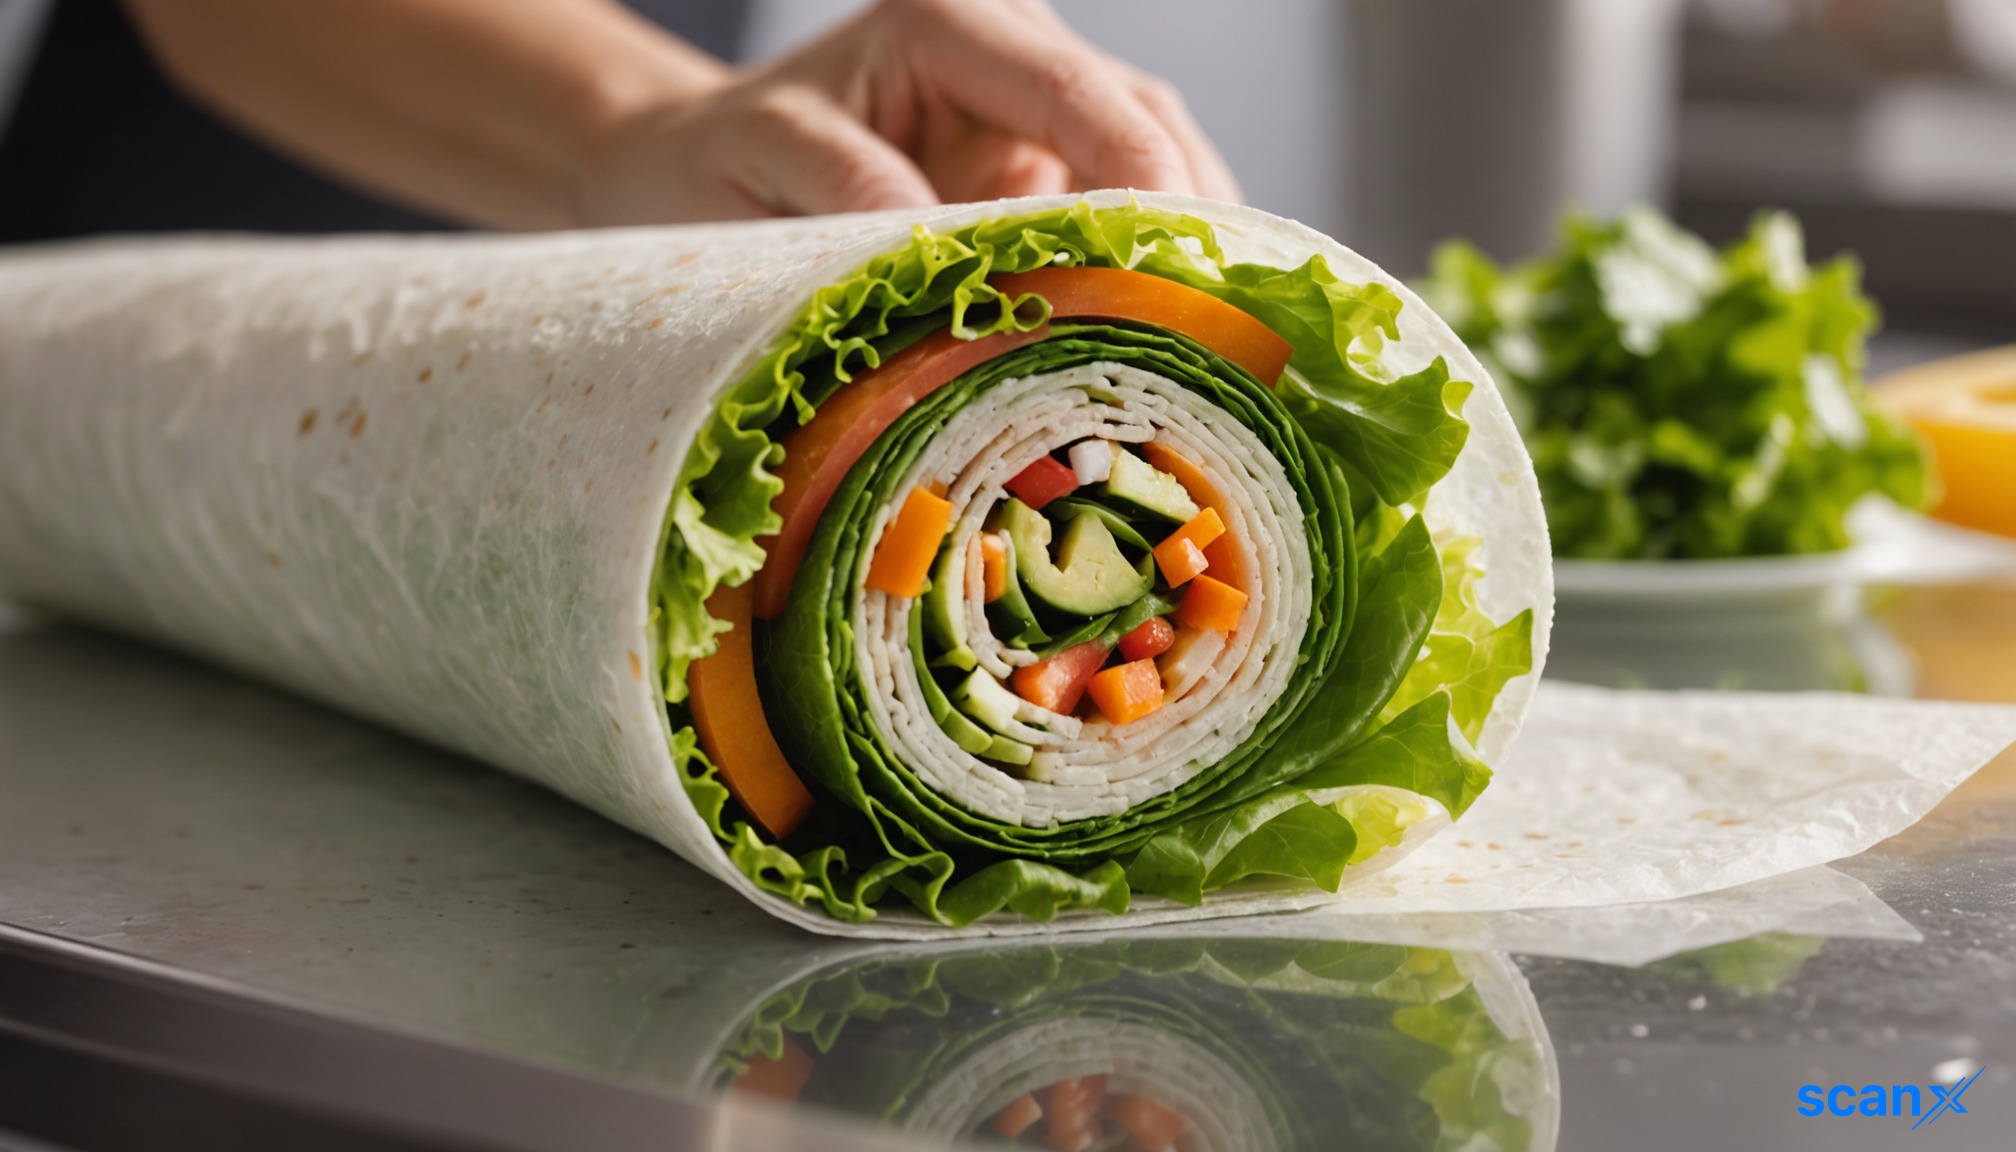

*this image is generated using AI for illustrative purposes only.
Sweetgreen Inc reported second-quarter fiscal year 2026 revenue of $192.7 million, marking a 4% increase year over year. However, comparable restaurant sales declined 6.2%, driven by a 2% drop in transactions and a 4.2% decline in product mix. The company recorded an adjusted EBITDA loss of $0.2 million, a sharp reversal from the $6.4 million profit reported in the prior-year period.
The quarter’s performance was impacted by strategic pricing adjustments and external health concerns. Management noted that the product mix headwind stemmed from targeted promotions and the introduction of wraps at a lower entry price point. Additionally, heightened consumer concern regarding a Cyclospora outbreak disrupted momentum in mid-July, impacting third-quarter guidance.
Financial Performance Overview
Restaurant-level profit stood at $25.2 million, representing a margin of 13.1%, down from 18.9% in the prior year. The contraction was driven by higher food, beverage, and packaging costs, which rose 210 basis points to 29.8% of revenue due to increased ingredient usage and portion investments. Labor costs also increased by 170 basis points to 29.2% of revenue, reflecting sales deleverage and wage inflation.
| Metric | Q2FY26 | Prior Year | Change |
|---|---|---|---|
| Total Revenue | $192.7 million | N/A | +4% YoY |
| Comparable Sales | -6.2% | N/A | Decline |
| Restaurant-Level Margin | 13.1% | 18.9% | -580 bps |
| Adjusted EBITDA | -$0.2 million | $6.4 million | Swing to Loss |
| Cash Position | $142.6 million | N/A | N/A |
Operational Highlights and Menu Innovation
Despite the overall decline, management highlighted sequential improvements in transaction trends. Comparable transactions improved from down 11.2% in the first quarter to roughly flat in June. The introduction of wraps contributed to this stabilization, achieving a 20% sales incidence and driving higher customer frequency, particularly among Gen Z consumers. Wraps also demonstrated strong retention, with more than half of guests returning within 30 days.
The company is testing a new 'Create Your Own' pricing model to enhance value perception. This initiative aims to simplify ordering and reduce price shock, with a full rollout planned by the end of the year. Furthermore, Sweetgreen ended the quarter with 287 restaurants, including two net new openings, while maintaining a conservative expansion strategy focused on high-return sites.
What the Numbers Show
A divergence exists between transaction volume stability and profitability metrics. While June transaction comps reached flat levels, indicating potential traffic recovery, the restaurant-level margin contracted significantly by 580 basis points. This suggests that the current volume is being supported by lower-margin mix shifts (wraps) and promotional activity rather than operational efficiency gains. The adjusted EBITDA swing from profit to loss underscores that top-line growth has not yet translated into bottom-line resilience amidst rising input costs.
Updated Guidance
Management revised its full-year FY26 outlook to account for the Cyclospora outbreak impact. Full-year comparable restaurant sales are now expected to decline between 8% and 7%. Restaurant-level profit margins are projected to range from 10.5% to 11%, and adjusted EBITDA is guided to a loss between $27 million and $23 million. The estimated impact of the disruption includes a 200 to 300 basis point drag on comparable sales and $7 to $10 million on EBITDA.

How will the full rollout of the 'Create Your Own' pricing model by year-end specifically impact average check size and customer retention rates in Q4?
What specific supply chain or menu engineering strategies is management implementing to reverse the 210 basis point increase in food and packaging costs in the second half of FY26?
Given the conservative expansion strategy, how might the reduced pace of new store openings affect Sweetgreen's long-term market share capture against faster-growing fast-casual competitors?









 Access Market Heat-map & Insights
  Create, Save & Share your Screener
  Use 200+ Screening Filters





