

Stove Kraft logs 33% renewable energy mix in FY26 sustainability report


Stove Kraft Limited’s FY26 BRSR highlights a 33% renewable energy mix, a 3:1 female-to-male workforce ratio, and a reduction in finished goods rejection rates to 0.7%. Scope 1 emissions fell to 206.18 tonnes, while Scope 2 emissions rose to 15,101.67 tonnes.


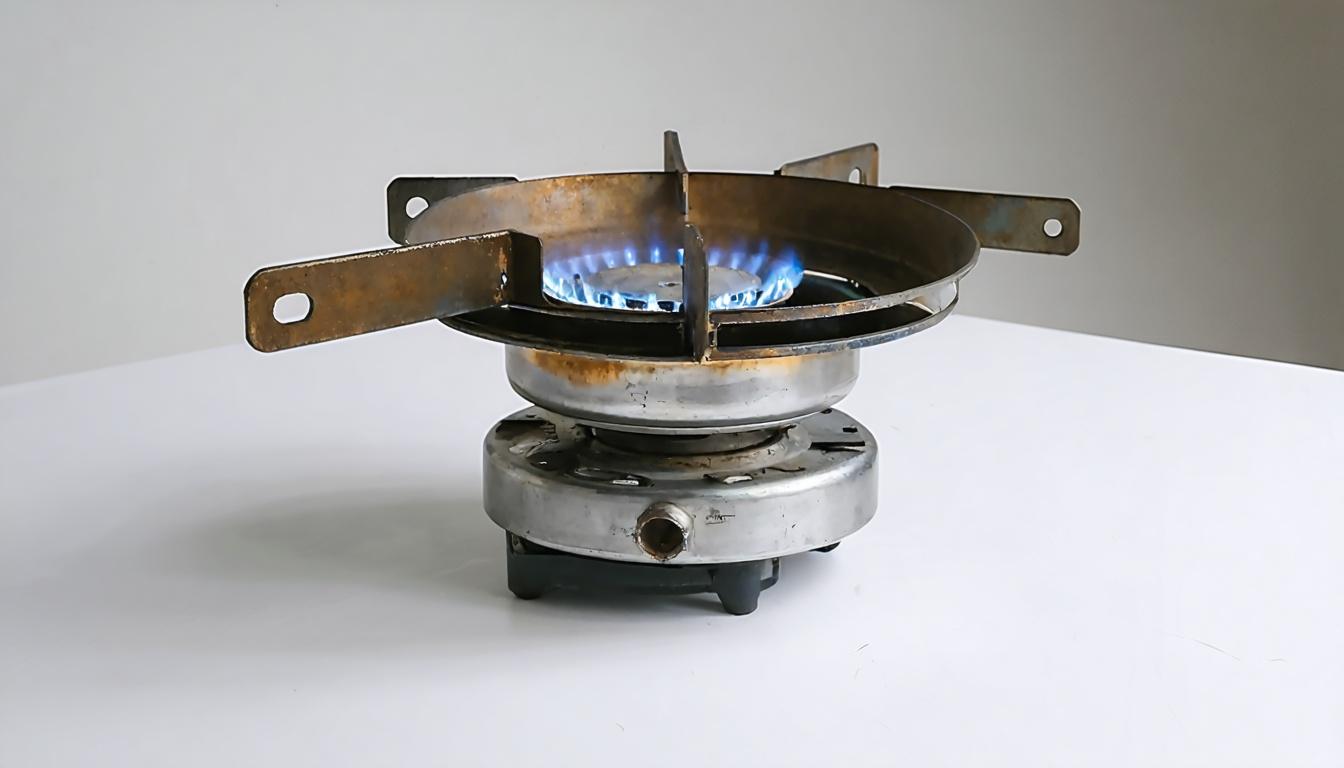
*this image is generated using AI for illustrative purposes only.
Stove Kraft Limited disclosed key sustainability metrics for FY26, highlighting a shift toward renewable energy and improved operational efficiency. The company reported that 33% of its total annual energy requirement of 3 crore units was sourced from renewables, comprising 70 lakh units from solar and 30 lakh units from wind power. This stands against a backdrop of rising grid electricity costs, with the company aiming to reach 65% renewable energy consumption by 2030.
Energy and Environmental Metrics
The company’s total energy consumption for FY26 stood at 1,29,993.95 GJ, an increase from 1,06,614.15 GJ in FY25. Scope 1 greenhouse gas emissions decreased significantly to 206.18 metric tonnes of CO2 equivalent, down from 295.5 metric tonnes in the previous year. However, Scope 2 emissions rose to 15,101.67 metric tonnes of CO2 equivalent, compared to 9,057.68 metric tonnes in FY25, reflecting increased reliance on purchased electricity despite the renewable mix.
Water management remains a critical focus, with the company withdrawing 57,436.67 kilolitres of groundwater. Stove Kraft implemented a Zero Liquid Discharge mechanism, recycling approximately 90% of water used within the facility through a 500 KL Sewage Treatment Plant (STP) and Effluent Treatment Plant (ETP). Total waste generated increased to 961.25 metric tonnes from 649.91 metric tonnes in FY25, driven largely by a rise in plastic waste to 610 metric tonnes.
| Metric | FY26 | FY25 |
|---|---|---|
| Total Energy Consumption (GJ) | 1,29,993.95 | 1,06,614.15 |
| Renewable Energy Share | 33% | Data Not Disclosed |
| Scope 1 Emissions (Tonnes CO2e) | 206.18 | 295.5 |
| Scope 2 Emissions (Tonnes CO2e) | 15,101.67 | 9,057.68 |
| Water Withdrawal (KL) | 57,436.67 | 56,863 |
Workforce and Social Impact
Stove Kraft reported a total workforce of 5,833 individuals, comprising 1,029 permanent employees and 4,804 workers. The company maintained a 3:1 female-to-male workforce ratio at its Harohalli manufacturing facility, exceeding industry averages for the manufacturing sector. Women constituted 10.01% of permanent employees and 55.33% of workers.
Employee turnover rates declined across categories. The turnover rate for permanent employees fell to 12% in FY26 from 23% in FY25. For permanent workers, the rate dropped to 13% from 49% in the prior year. The company spent 0.39% of total revenue on employee well-being measures, slightly lower than the 0.40% recorded in FY25.
Operational Efficiency
Quality control improvements were evident in the reduction of finished goods rejections, which fell from 1.73% in FY25 to 0.7% in FY26. This improvement aligns with the company’s adherence to global standards such as the IKEA IWAY Principles. The company also reported 786,997 customer complaints received during the year, with 12,211 pending resolution at year-end, compared to 712,994 complaints and 13,484 pending cases in FY25.
What the Numbers Show
The divergence between declining Scope 1 emissions and rising Scope 2 emissions indicates that while on-site operational efficiency has improved, the overall carbon footprint is increasingly tied to external electricity procurement. The simultaneous drop in employee turnover and finished goods rejection rates suggests that workforce stability initiatives are directly correlating with higher manufacturing quality standards.
Historical Stock Returns for Stove Kraft
| 1 Day | 5 Days | 1 Month | 6 Months | 1 Year | 5 Years |
|---|---|---|---|---|---|
| +0.57% | -0.71% | +3.64% | +59.55% | +19.69% | -15.86% |

How will Stove Kraft finance the infrastructure upgrades required to bridge the gap from 33% to its 2030 target of 65% renewable energy consumption?
What specific strategies is the company implementing to mitigate the rise in Scope 2 emissions, given the increasing reliance on purchased grid electricity?
How does the significant increase in plastic waste generation correlate with product packaging changes, and what circular economy initiatives are planned to address this?
 15
15








 Access Market Heat-map & Insights
  Create, Save & Share your Screener
  Use 200+ Screening Filters





