

Stove Kraft FY26 Results: Net debt falls 85%, cash flow doubles


Stove Kraft Limited delivered a strong FY26 performance with revenue rising 10.9% to ₹1,607.4 crore and PAT up 9.1% to ₹42.0 crore. Gross margins expanded by 60 bps to 38.7% due to manufacturing integration. The company drastically reduced net debt to ₹27.1 crore and doubled operating cash flow to ₹258 crore, improving ROCE to 11.2%.


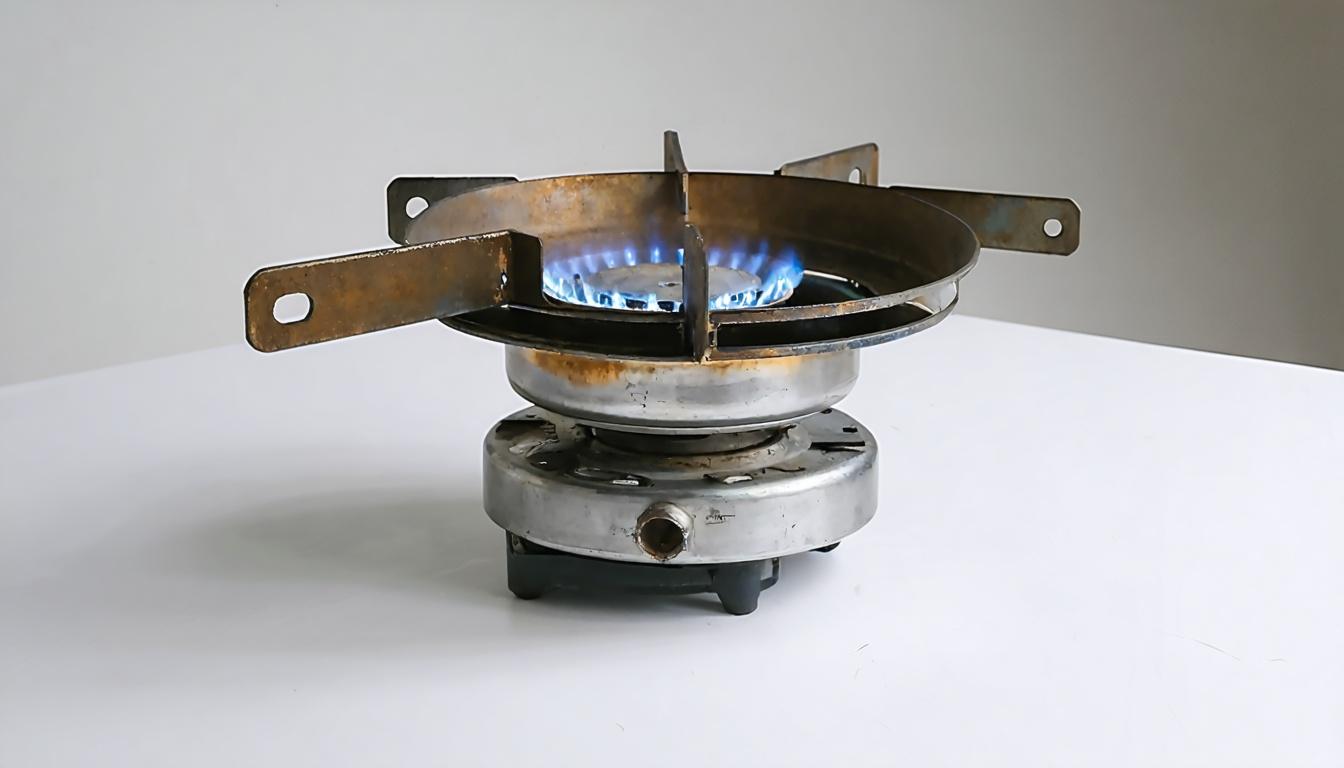
*this image is generated using AI for illustrative purposes only.
Stove Kraft Limited reported robust financial performance for the fiscal year ended March 31, 2026, highlighting disciplined execution and significant balance sheet strengthening. Revenue from operations grew 10.9% year-on-year to ₹1,607.4 crore, supported by a wider category mix and multiple routes to market. Profit after tax (PAT) increased by 9.1% to ₹42.0 crore, reflecting improved operational efficiency and margin expansion.
The most notable development was the substantial improvement in liquidity and debt reduction. Net debt declined sharply from ₹176.8 crore in the previous year to just ₹27.1 crore, a reduction of over 84%. This deleveraging was facilitated by enhanced internal cash generation and disciplined working capital management.
Financial Performance
| Metric: | FY2025-26 | FY2024-25 | Change |
|---|---|---|---|
| Revenue from operations: | ₹1,607.4 crore | ₹1,449.8 crore | +10.9% |
| Gross Profit: | ₹622.5 crore | ₹552.3 crore | +12.7% |
| Gross Margin: | 38.7% | 38.1% | +60 bps |
| EBITDA: | ₹166.1 crore | ₹150.7 crore | +10.3% |
| Profit After Tax: | ₹42.0 crore | ₹38.5 crore | +9.1% |
Gross profit grew faster than revenue at 12.7%, leading to an expansion in gross margin by 60 basis points to 38.7%. This margin improvement was attributed to manufacturing integration and an evolving product mix that favored higher-value categories. EBITDA stood at ₹166.1 crore, representing a 10.3% growth over the prior year.
Cash Flow and Working Capital
Cash flow from operations more than doubled to approximately ₹258 crore from ₹130 crore in the previous year. This surge in cash generation was underpinned by a dramatic tightening of the working capital cycle, which reduced from 64 days to just 23 days. Lower inventory and receivable days, combined with higher payable days, released significant capital for the business.
Return on capital employed (ROCE) improved to 11.2% from 9.6% in the prior year, signaling better utilization of deployed capital as the company moves into a phase of higher capacity utilization with lower incremental capex requirements.
Operational Highlights
The company expanded its exclusive retail footprint to 329 stores across 22 states and 151 cities, adding 67 new outlets during the year. Own retail contributed 7.5% of total revenue. Induction cooktops delivered strong value growth of 23.9% and volume growth of 11.7%, indicating growing consumer adoption of electric cooking solutions.
Strategic initiatives included a partnership with IKEA, for which the company invested ₹58 crore in dedicated tooling and infrastructure. Production and revenue recognition from this partnership are expected to commence progressively in FY27. The company also entered the HoReCa segment with the launch of heavy-duty infrared cooktops.
What the Numbers Show
A key analytical observation is the divergence between top-line growth and bottom-line leverage. While revenue grew at a healthy double-digit pace, the company prioritized balance sheet repair over aggressive expansion. The near-doubling of operating cash flows relative to PAT suggests that earnings quality has improved significantly, with profits being converted efficiently into cash rather than getting trapped in working capital. This shift provides Stove Kraft with greater financial flexibility to fund future growth internally.
Historical Stock Returns for Stove Kraft
| 1 Day | 5 Days | 1 Month | 6 Months | 1 Year | 5 Years |
|---|---|---|---|---|---|
| +0.60% | -0.68% | +3.67% | +59.59% | +19.72% | -15.84% |

How will the near-debt-free balance sheet influence Stove Kraft's strategy for potential M&A activity or accelerated capacity expansion in FY27?
What is the projected revenue contribution timeline and margin profile for the IKEA partnership once production commences in FY27?
Can the 60-basis point gross margin expansion be sustained as the company scales its exclusive retail footprint and enters the competitive HoReCa segment?
 19
19








 Create Custom Screeners
  Access 200+ Pre-built Filters
  Use 50+ Readymade Screener





