SPL Industries applies for LOI to set up industrial colony in Haryana

scanx
Reviewed by
Anirudha BScanX News Team
Key Highlights
  • Applied for Letter of Intent for industrial colony in Palwal, Haryana
  • Land of 7.4375 acres registered in company name following December 2025 purchase
  • Development to be undertaken via arrangement, not direct construction
  • Application filed under Regulation 30 of SEBI LODR Regulations, 2015
powered bylight_fuzz_icon
52990387

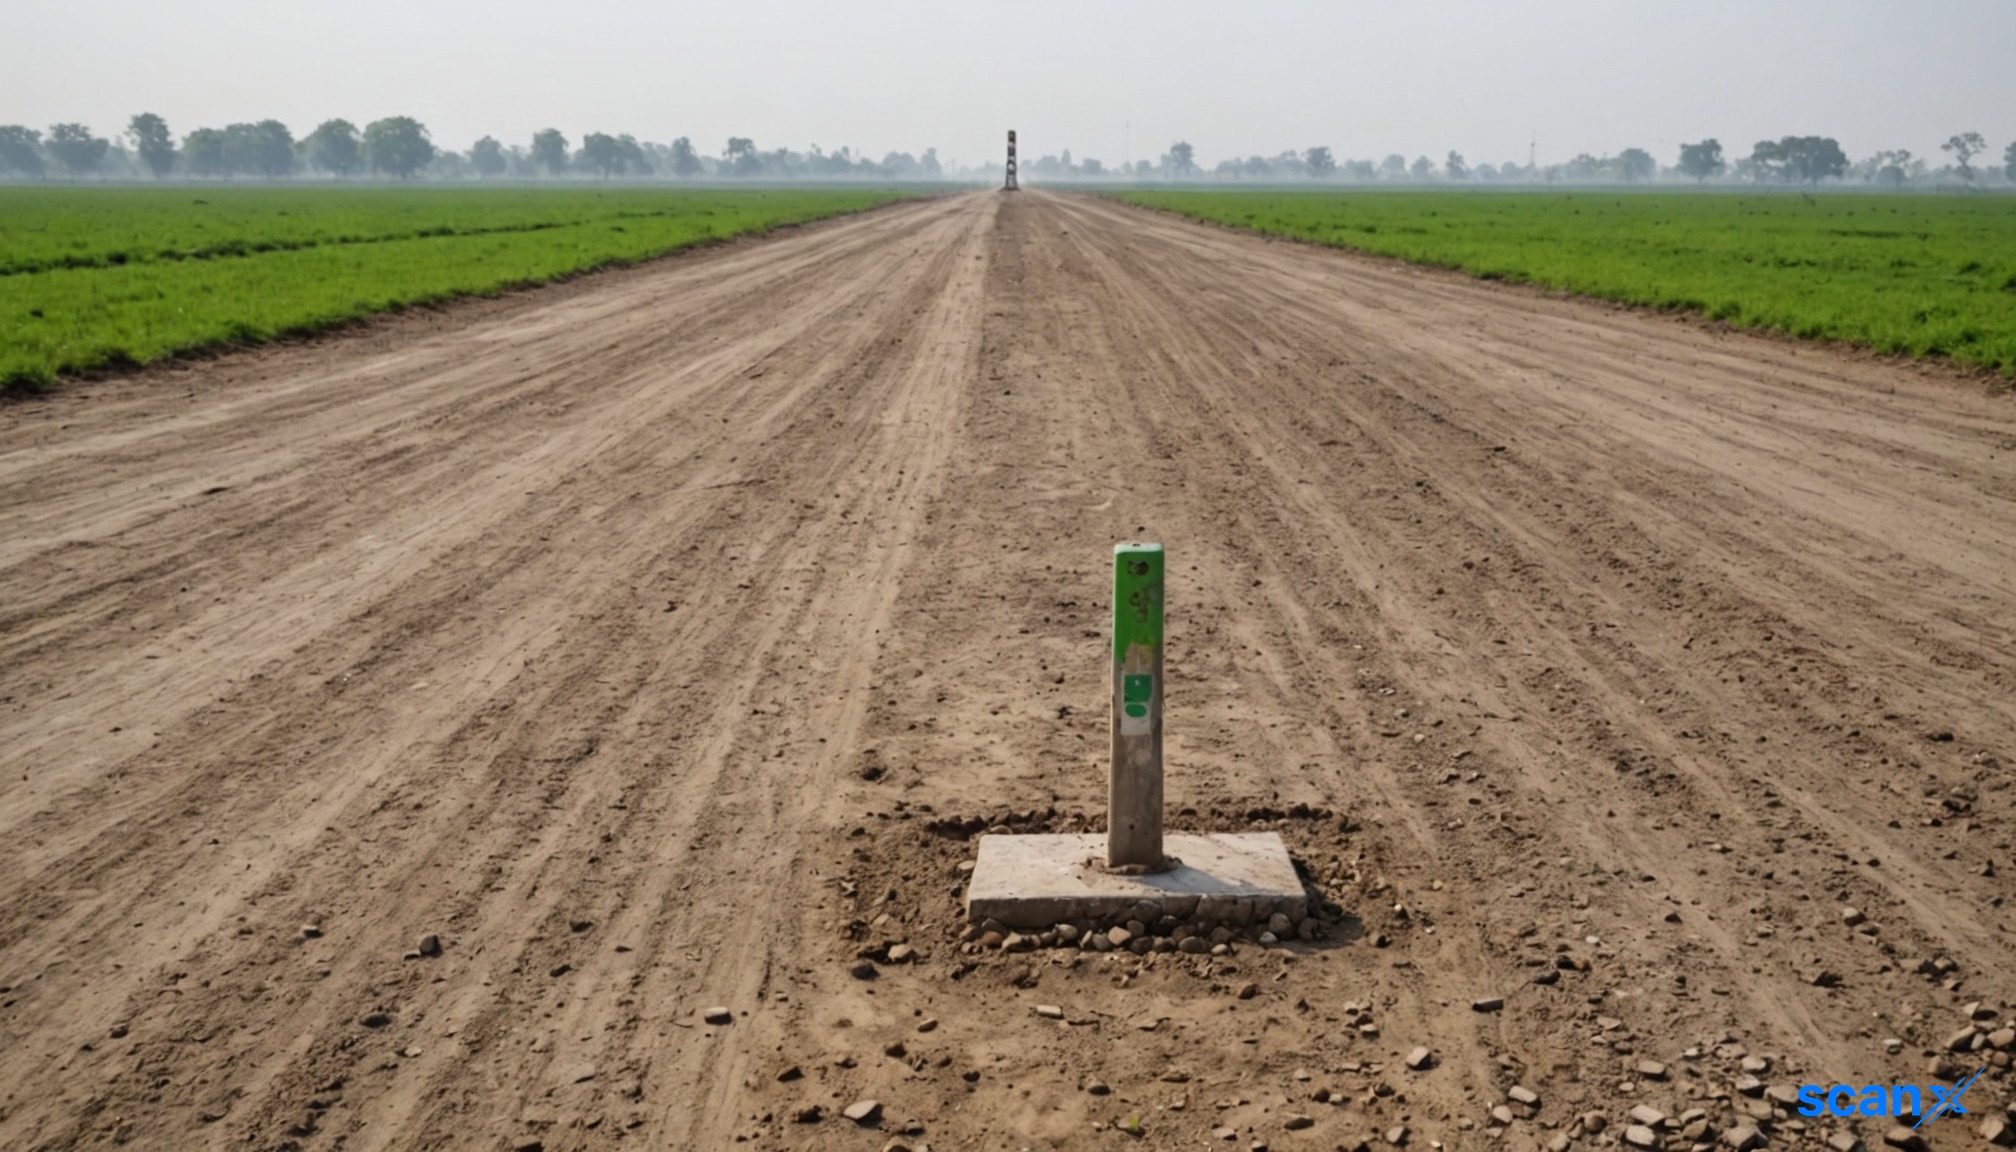
*this image is generated using AI for illustrative purposes only.

SPL Industries has applied for a Letter of Intent (LOI) to establish an industrial colony in Village Prithla, District Palwal, Haryana. The application is at an advanced stage with the Directorate of Town and Country Planning (DTCP), and the LOI is expected shortly.

This move follows the company's earlier disclosure on December 3, 2025, regarding the purchase of land in the same location. The land, measuring 59 Kanal 10 Marla (7.4375 acres), has since been registered in the name of the company. No transfer of title has occurred as of the filing date.

Regulatory Filing Details

The intimation was submitted under Regulation 30 of SEBI (Listing Obligations and Disclosure Requirements) Regulations, 2015. The company stated that the industrial colony will be developed through a development arrangement. Further disclosures regarding this arrangement will be made in due course.

Detail Information
Location Village Prithla, District Palwal, Haryana
Land Area 59 Kanal 10 Marla (7.4375 acres)
Status Registered in company name; LOI application pending
Authority Directorate of Town and Country Planning (DTCP), Haryana

What the Numbers Show

The progression from land acquisition to regulatory application indicates a strategic shift from asset holding to operational development. The specific area of 7.4375 acres defines the scale of the proposed industrial colony, while the reliance on a "development arrangement" suggests SPL Industries may not undertake direct construction capital expenditure, potentially preserving cash flow while leveraging real estate assets for commercial gain.

Historical Stock Returns for SPL Industries

1 Day5 Days1 Month6 Months1 Year5 Years
-2.41%-3.04%-8.81%+8.33%-26.86%-41.55%

Who are the potential partners or developers involved in the 'development arrangement' for the industrial colony?

How will the industrial colony development impact SPL Industries' capital expenditure profile and cash flow in the next fiscal year?

What is the expected timeline for the DTCP to issue the Letter of Intent and subsequent construction phases?

SPL Industries Q1 Results: Net profit up 134% YoY to ₹2.13 crore

scanx
Reviewed by
Shriram SScanX News Team
Key Highlights

SPL Industries Ltd posted a 134% YoY jump in Q1FY27 net profit to ₹2.13 crore, aided by a 16% rise in total revenue to ₹23.55 crore. Trading revenues surged 41% while manufacturing income fell 14%. Operating expenses grew slower than revenue, boosting margins significantly.

powered bylight_fuzz_icon
48093560

*this image is generated using AI for illustrative purposes only.

SPL Industries reported a net profit of ₹2.13 crore for the quarter ended June 30, 2026 (Q1FY27), a significant improvement from the ₹91.30 lakh posted in the corresponding period of FY26. The company’s total income from operations reached ₹23.55 crore, up 16% year-on-year, reflecting robust performance in its garment trading segment which offset a decline in manufacturing processing income.

The Board of Directors approved the unaudited standalone financial results in a meeting held on August 12, 2026. Statutory auditors Raghu Nath Rai & Co. issued a limited review report, confirming that the statements comply with Ind AS and SEBI LODR regulations.

Financial Performance Highlights

The company’s profitability expanded sharply as operating efficiencies helped contain costs relative to revenue growth. While net sales from operations grew modestly by 16% to ₹19.40 crore, other income contributed significantly to the top line, rising to ₹4.15 crore from ₹3.72 lakh in Q1FY26.

Metric: Q1FY27 Q1FY26 Change
Revenue from Operations: ₹19.40 crore ₹16.64 crore +16.6%
Total Income: ₹23.55 crore ₹20.36 crore +15.7%
Total Expenses: ₹21.04 crore ₹19.12 crore +10.0%
Profit Before Tax: ₹2.52 crore ₹1.24 crore +103.0%
Net Profit: ₹2.13 crore ₹91.30 lakh +134.0%
EPS (Basic): ₹0.73 ₹0.31 +135.5%

Segment-wise Breakdown

SPL Industries operates through two primary segments: Manufacturing/Processing and Trading of Garments. The trading segment emerged as the key growth driver, with revenues surging 41% year-on-year to ₹15.57 crore, compared to ₹11.06 crore in Q1FY26. In contrast, manufacturing/processing income declined 14% to ₹7.99 crore from ₹9.29 crore in the prior year.

Despite the drop in manufacturing turnover, the segment’s result improved to ₹22.23 crore from ₹13.16 crore, indicating better margin realization or cost control within that division. The trading segment also delivered stronger results, rising to ₹30.40 crore from ₹25.98 crore.

What the Numbers Show

A notable divergence exists between the company’s operational revenue growth and its profit expansion. While total revenue grew by approximately 16%, pre-tax profits more than doubled (up 103%). This disparity is largely attributable to the disproportionate growth in other income, which increased by nearly 12% absolute terms to ₹4.15 crore. With other income constituting roughly 18% of total income this quarter compared to 18% last year, the profit surge is primarily driven by improved operating leverage—expenses rose only 10% against a 16% revenue jump—rather than a shift in revenue mix.

The company’s earnings per share (EPS) stood at ₹0.73, up from ₹0.31 in Q1FY26. There were no exceptional items or extraordinary gains recorded during the period. One customer complaint regarding non-receipt of securities was received and resolved within the quarter.

Historical Stock Returns for SPL Industries

1 Day5 Days1 Month6 Months1 Year5 Years
-2.41%-3.04%-8.81%+8.33%-26.86%-41.55%

How sustainable is the current profit growth trajectory given that the surge was primarily driven by operating leverage and other income rather than core manufacturing revenue?

What specific strategic initiatives is SPL Industries implementing to reverse the 14% decline in its manufacturing/processing segment revenue?

Could the significant increase in 'other income' indicate a shift in the company's capital allocation strategy or investment portfolio performance for the coming quarters?

More News on SPL Industries

1 Year Returns:-26.86%