

Somany Ceramics Q1 Results: Net profit jumps 109% YoY to ₹34.23 crore


Somany Ceramics delivered strong Q1FY26 results with consolidated net profit jumping 109% YoY to ₹34.23 crore, outpacing an 18.9% revenue rise to ₹749.56 crore. Standalone PAT also grew 110% to ₹35.11 crore. Basic EPS rose to ₹8.66 from ₹2.53.


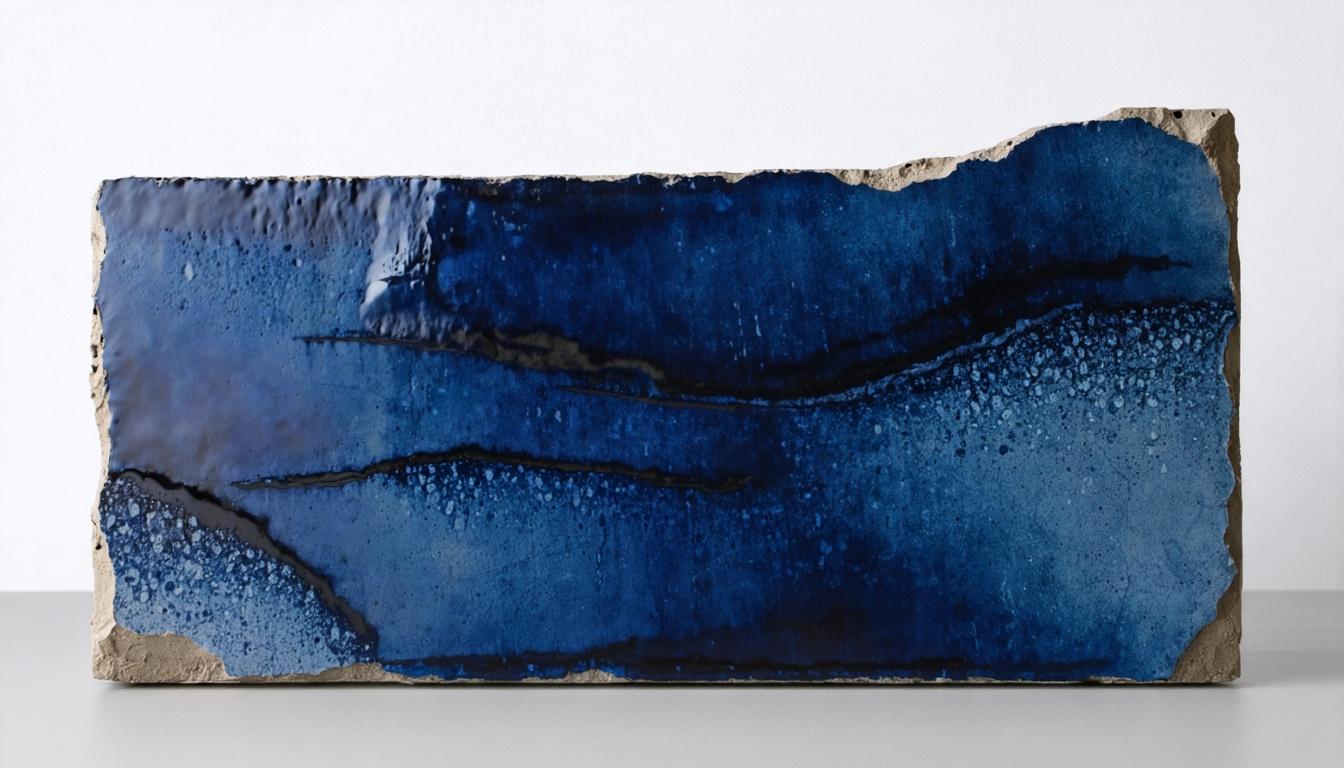
*this image is generated using AI for illustrative purposes only.
Somany Ceramics Ltd reported a sharp acceleration in profitability for the first quarter of fiscal 2026, with consolidated net profit after tax rising 109% year-on-year to ₹34.23 crore. The ceramic tiles and building solutions manufacturer also posted an 18.9% growth in consolidated revenue from operations, which reached ₹749.56 crore compared to ₹604.44 crore in the corresponding period of FY25.
The results were announced on August 13, 2026, following the Board of Directors' meeting held on August 12, 2026, in Noida. The financial statements were reviewed by the Audit Committee and approved by the Board, with statutory auditors conducting a limited review as per SEBI (Listing Obligations and Disclosure Requirements) Regulations, 2015.
Financial Performance
On a standalone basis, the company’s net profit after tax grew 110% to ₹35.11 crore from ₹16.76 crore in Q1FY25. Standalone revenue from operations increased 18.9% to ₹691.86 crore, up from ₹581.82 crore in the prior year period.
| Metric | Q1FY26 Consolidated | Q1FY25 Consolidated | Change |
|---|---|---|---|
| Revenue from Operations | ₹749.56 crore | ₹604.44 crore | +18.9% |
| Net Profit After Tax | ₹34.23 crore | ₹7.35 crore | +109.0% |
| Basic EPS (₹) | 8.66 | 2.53 | +242.3% |
For the full fiscal year ended March 31, 2026, consolidated net profit stood at ₹74.07 crore against ₹113.87 crore in the nine months leading up to March 31, 2026 (audited). The company maintains an equity share capital of ₹8.20 crore.
What the Numbers Show
The divergence between revenue growth and profit expansion highlights significant operational leverage or margin improvement during the quarter. While revenue grew nearly 19%, net profit more than doubled. This suggests that cost controls or favorable product mix dynamics contributed disproportionately to the bottom line relative to top-line sales growth. Additionally, basic earnings per share (EPS) surged to ₹8.66 from ₹2.53 in the previous year, reflecting the direct impact of higher profitability on shareholder value metrics.
Historical Stock Returns for Somany Ceramics
| 1 Day | 5 Days | 1 Month | 6 Months | 1 Year | 5 Years |
|---|---|---|---|---|---|
| -0.57% | +3.00% | +8.80% | +72.02% | +37.56% | -18.67% |

Will Somany Ceramics be able to sustain the significant margin expansion observed in Q1FY26 as input costs fluctuate in the coming quarters?
How will the company allocate the increased profits—through dividend payouts, debt reduction, or capital expenditure for capacity expansion?
What specific operational efficiencies or product mix shifts drove the disproportionate profit growth compared to revenue, and are these factors replicable?
 17
17







 Access Market Heat-map & Insights
  Create, Save & Share your Screener
  Use 200+ Screening Filters





