Sobha Ltd H1FY27 Results: Record sales value of ₹58.62 Bn, Q2 up 16%

scanx
Reviewed by
Shriram SScanX News Team
Key Highlights
  • Sobha Ltd recorded record H1FY27 sales value of ₹58.62 Bn
  • Q2FY27 sales value rose 16% YoY to ₹22.06 Bn
  • Average selling price increased to ₹15,604 per sq ft in H1FY27
  • Bangalore contributed 57.7% of total sales value at ₹33.85 Bn
powered bylight_fuzz_icon
52490597

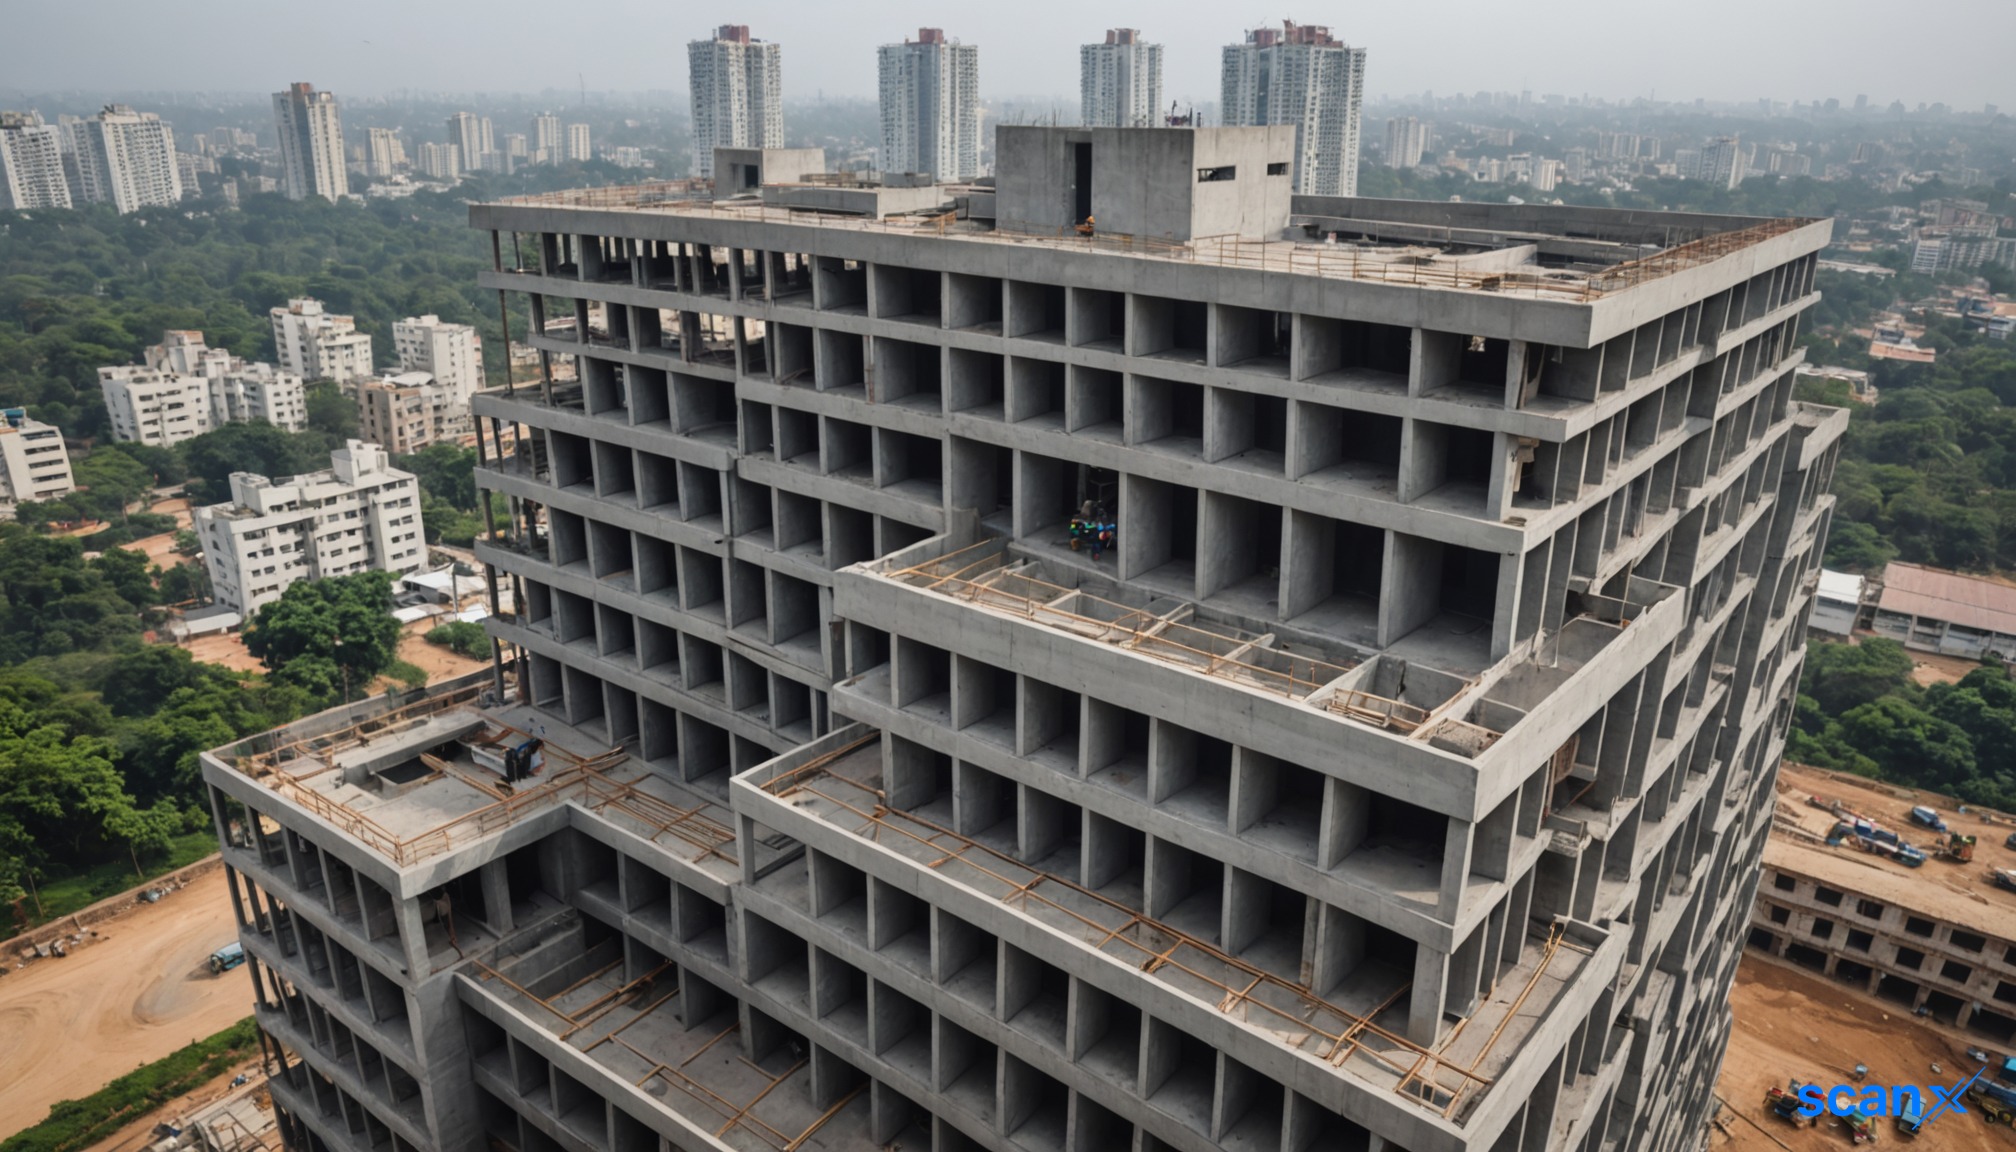
*this image is generated using AI for illustrative purposes only.

Sobha Limited recorded its highest-ever half-yearly sales value of ₹58.62 Bn for the first half of FY27, marking a significant milestone in its operational performance.

The company sold 3.76 million sq ft of area across 2,260 units during this period, reflecting a robust response to new project launches. Sobha's share of the total sales value also reached a historic high of ₹48.74 Bn, underscoring the strength of its owned inventory and joint venture structures.

Regional performance and growth drivers

Bangalore emerged as the primary contributor to sales, accounting for ₹33.85 Bn, or 57.7% of the total value. The National Capital Region (NCR) followed with ₹19.74 Bn, representing 33.7% of the total. The Kerala region contributed ₹3.57 Bn (6.1%), while other cities collectively added ₹1.46 Bn (2.5%).

The surge in sales was supported by the launch of 7.91 million sq ft of saleable area across five projects in Bangalore, Gurgaon, and Calicut, carrying a potential sale value of ₹112 Bn. Additionally, the company completed 1,391 homes totaling 2.56 million sq ft across 17 wings or blocks.

Q2FY27 operational snapshot

In the second quarter alone, Sobha logged a sales value of ₹22.06 Bn, which stands as the second-highest quarterly figure in the company's history. This represented a 16% growth compared to Q2FY26. The quarter saw the sale of 1.42 million sq ft across 828 units, with Sobha's share amounting to ₹18.82 Bn.

Sustenance sales remained strong, driven by projects such as Sobha OneWorld and Sobha Neopolis in Bangalore, alongside Sobha Crescent and Sobha Aranya in Gurgaon. The company launched two new projects in Calicut and Mysore during Q2FY27, adding 1.03 million sq ft to its pipeline.

Metric Q2FY27 Q2FY26 H1FY27 H1FY26
Sales Value (Total) ₹22,063 Mn ₹19,026 Mn ₹58,624 Mn ₹39,814 Mn
Sales Area (Mn sq ft) 1.42 1.39 3.76 2.84
Avg Price (₹/sq ft) 15,522 13,648 15,604 14,028
SOBHA's Share (%) 85.3% 80.8% 83.1% 81.7%

What the numbers show

A key observation from the data is the divergence between volume growth and price realization. While sales area grew by 32.4% YoY in H1FY27, the sales value increased by 47.2%. This indicates that the growth was not solely driven by higher unit volumes but also by a significant improvement in average selling prices, which rose to ₹15,604 per sq ft in H1FY27 from ₹14,028 per sq ft in H1FY26. Furthermore, Sobha's share of sales value increased to 83.1% in H1FY27 from 81.7% in the previous year, suggesting a strategic shift towards projects where the company holds a larger equity stake or direct ownership, thereby capturing more margin per unit sold.

Historical Stock Returns for Sobha

1 Day5 Days1 Month6 Months1 Year5 Years
-0.70%-2.47%-4.50%+2.16%-21.30%+57.80%
Disclaimer: This article is AI-generated using data from LiveSquawk. ScanX is not liable for any inaccuracies.

How will the ₹112 Bn potential sale value from newly launched projects impact Sobha's revenue visibility and cash flow projections for the second half of FY27?

What specific factors are driving the significant price realization increase to ₹15,604/sq ft, and is this premium sustainable in the face of rising input costs?

How does Sobha's strategic shift toward higher equity stakes (83.1% share) affect its balance sheet leverage and return on capital employed compared to joint-venture-heavy peers?

Sobha reports record Q1 FY27 sales of ₹3,656 crore

scanx
Reviewed by
Naman SScanX News Team
Key Highlights

Sobha Limited delivered a landmark Q1 FY27 with record real estate sales of ₹3,656 crore, up 76% year-on-year, fueled by successful launches like Sobha One World and Sobha Crescent. Profit after tax jumped 274% to ₹50.7 crore amidst 48% revenue growth. The company ended the quarter with a net cash position of ₹659 crore and outlined a robust pipeline of 8.2 million sq. ft. for the rest of FY27.

powered bylight_fuzz_icon
46092838

*this image is generated using AI for illustrative purposes only.

Sobha achieved its highest-ever quarterly real estate sales value of ₹3,656 crore in Q1 FY27, marking a 76% year-on-year surge driven by robust demand for premium launches in Bangalore and the National Capital Region (NCR). The company reported a profit after tax (PAT) of ₹50.7 crore, a 274% increase from ₹13.5 crore in the corresponding quarter of the previous year. Total income rose 48% to ₹1,330 crore, while operational cash inflows grew 8.2% to ₹1,924 crore. Managing Director Jagadish Nangineni attributed the performance to well-prepared project launches, including Sobha One World and Sobha Crescent, which collectively contributed significantly to the record booking value.

Financial Performance

Revenue from operations increased 48% to ₹1,330 crore, with real estate revenue jumping approximately 60% to ₹1,107 crore compared to ₹690 crore in Q1 FY26. Revenue from contractual, manufacturing, and retail businesses stood at ₹171 crore. The company maintained a net cash position of ₹659 crore, with gross debt at ₹1,110 crore and cash equivalents at ₹1,769 crore. The average borrowing cost remained competitive at 7.62%. Net debt-to-equity ratio stood at -0.14.

Metric (₹ in crores): Q1 FY27 Q1 FY26 Change (%)
Total Income: 1,330 898 +48%
Real Estate Revenue: 1,107 690 +60%
Other Business Revenue: 171 162 +5.6%
Profit After Tax: 50.7 13.5 +274%
Operational Cash Inflow: 1,924 1,778 +8.2%

Operational Highlights

Sobha sold 2.34 million sq. ft. across 1,432 homes, with an average price realization of ₹15,655 per sq. ft. Bangalore emerged as the strongest market, contributing 57% of quarterly sales (₹2,067 crore), while NCR delivered its highest-ever quarterly sales of ₹1,384 crore. During the quarter, the company completed 677 homes covering 1.08 million sq. ft. Land investment increased to ₹370 crore, including new acquisitions in Mumbai (₹180 crore for 1.3 acres) and Greater Noida. Project-related expenditure rose in line with construction activity.

Pipeline and Future Guidance

The company launched three new projects with a combined saleable area of 6.89 million sq. ft. and a potential sale value of ₹10,000 crore. Sobha One World in Hoskote accounted for 45% of total sales, with 40% of the released 3.4 million sq. ft. sold at launch. For the remainder of FY27, Sobha plans to launch 9 projects aggregating approximately 8.2 million sq. ft., with a projected GDV of ₹12,000 crore. Completion targets for FY27 are set at 6–6.5 million sq. ft., up from 5.4 million sq. ft. in FY26. Management expects EBITDA margins to improve sequentially, targeting 17–20% by Q4 FY27 from the current 9.7%.

Regulatory Disclosures

The Board approved the issuance of non-convertible debentures (NCDs) aggregating up to ₹10,000 crore on a private placement basis, to be issued in tranches as acquisition opportunities arise. The independent auditor’s review report highlighted ongoing legal proceedings, including an Enforcement Directorate complaint regarding a joint development agreement in Gurugram, leading to the provisional attachment of land parcels valued at ₹2,016.05 million held by Technobuild Developers Private Limited. Additionally, the Income Tax Department has issued demand orders totaling ₹842 million for various assessment years, against which appeals have been filed.

What the Numbers Show

The significant divergence between the 76% surge in sales value and the modest 8.2% growth in collections indicates a timing mismatch, as noted by management due to late-quarter bookings and labor-related milestone delays. However, the strong net cash position of ₹659 crore despite ₹370 crore in land investments underscores financial discipline. The shift towards joint development models in the forthcoming pipeline may compress marginal cash flows compared to previous years, but the substantial unsold inventory of 14.94 million sq. ft. provides long-term revenue visibility.

Historical Stock Returns for Sobha

1 Day5 Days1 Month6 Months1 Year5 Years
-0.70%-2.47%-4.50%+2.16%-21.30%+57.80%

How will the shift towards joint development models in the upcoming pipeline impact Sobha's long-term EBITDA margins and cash flow stability compared to their traditional land acquisition strategy?

What are the potential financial and operational risks posed by the Enforcement Directorate's provisional attachment of land parcels in Gurugram, and how might this affect future project launches in the NCR region?

Given the significant divergence between record sales bookings and modest collection growth, what specific strategies is management implementing to accelerate cash inflows and mitigate liquidity pressure in Q2 FY27?

More News on Sobha

1 Year Returns:-21.30%