Smartworks FY26 Results: Revenue Up 31% to ₹1,796 Cr, Analyst Meet Transcript Filed


Smartworks Coworking Spaces Limited reported strong FY26 results with revenue up 31% to ₹1,796 crore and normalised EBITDA surging 75% to ₹314 crore. The company achieved its first full-year PAT profitability at ₹11 crore and crossed 10 million sq ft of operational area. The analyst meet transcript was filed with NSE and BSE on May 6, 2026, under Regulation 30.
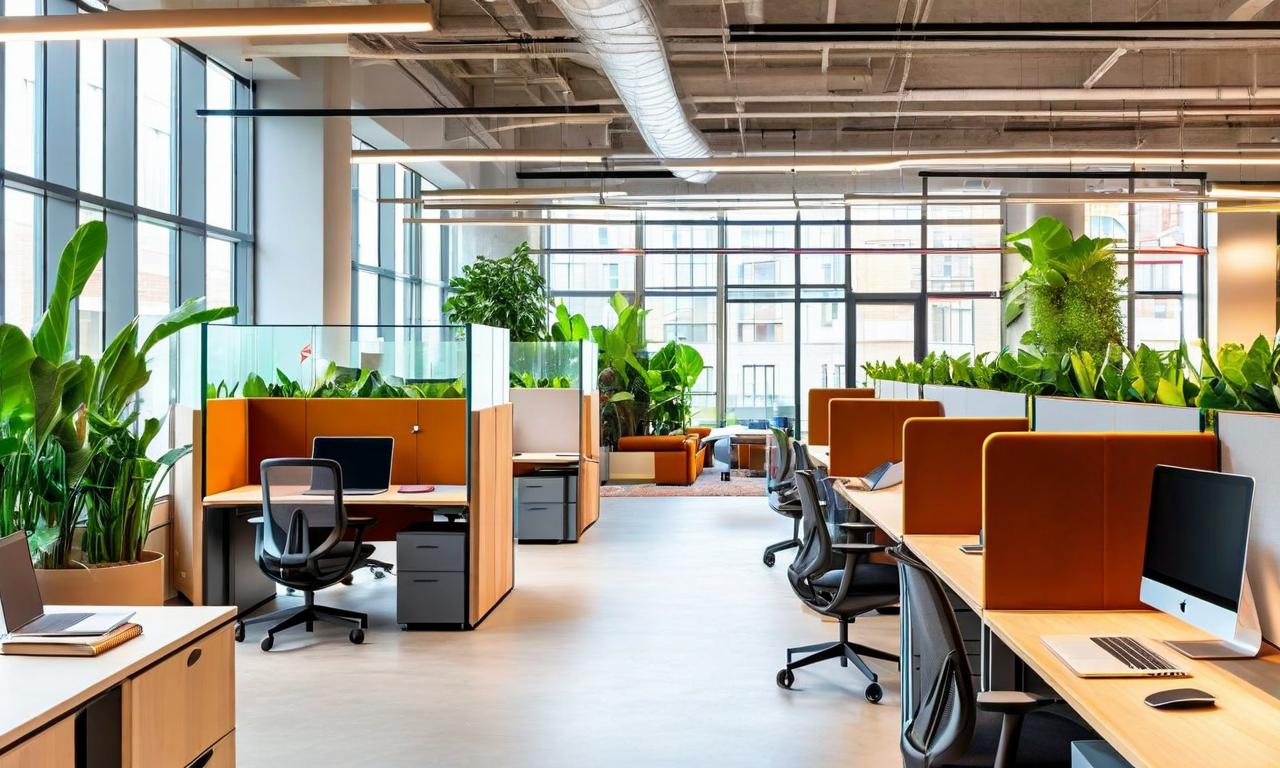

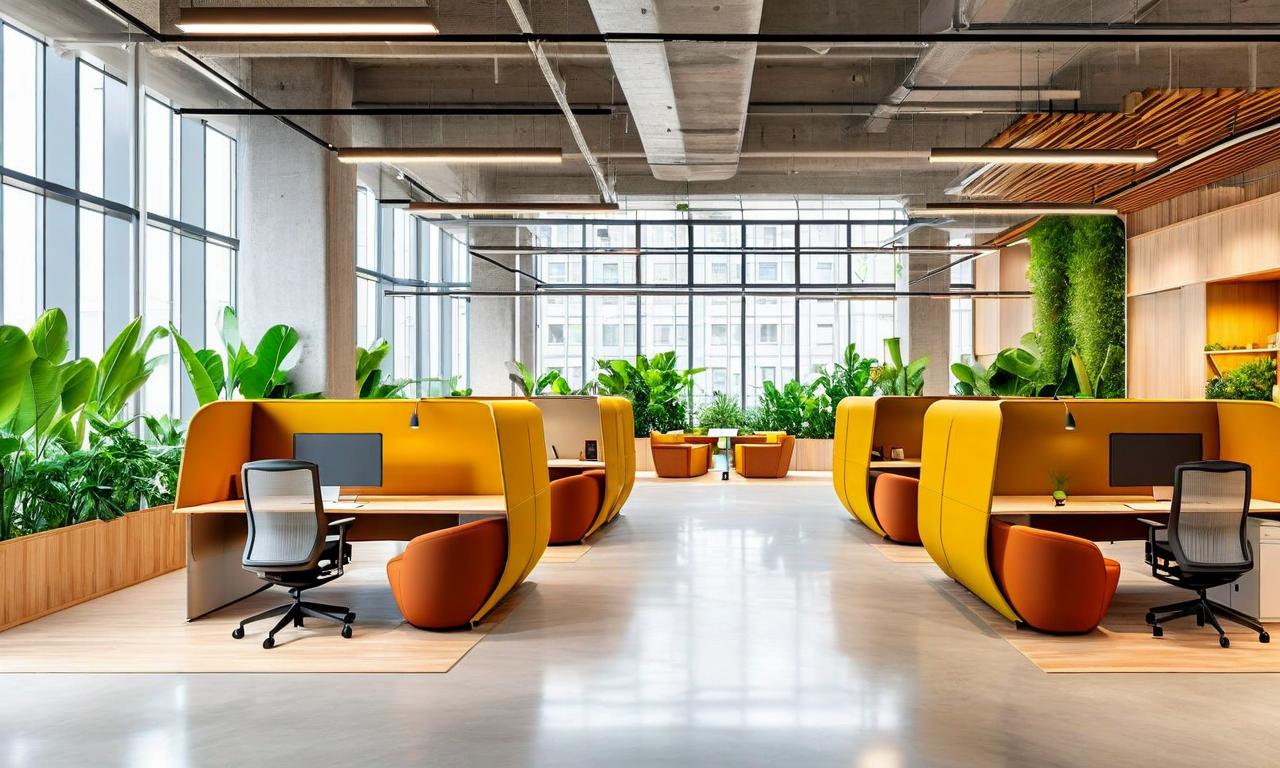
*this image is generated using AI for illustrative purposes only.
Smartworks Coworking Spaces Limited has officially announced the approval of its audited financial results for FY26 at a Board of Directors meeting held on April 30, 2026. The company delivered exceptional performance in its first financial year as a listed entity, achieving revenue from operations of ₹1,796 crore, representing 31% year-on-year growth, while normalised EBITDA surged 75% to ₹314 crore with an expanded margin of 17.5%. In a subsequent regulatory disclosure under Regulation 30 of the SEBI (Listing Obligations and Disclosure Requirements) Regulations, 2015, the company filed the transcript of its analyst meet with both NSE and BSE on May 6, 2026, with the transcript available on its investor relations website.
Board Meeting and Regulatory Compliance
The Board of Directors meeting commenced at 09:30 A.M. (IST) and concluded at 10:28 A.M. (IST) on April 30, 2026. The board approved the audited standalone and consolidated financial statements for the quarter and financial year ended March 31, 2026, along with statutory audit reports. Deloitte Haskins & Sells LLP, the company's statutory auditors, issued audit reports with unmodified opinion on the annual audited financial results. Following the board meeting, an analyst meet was conducted through audio means, commencing at 04:00 P.M. (IST) and concluding at 05:05 P.M. (IST) on the same day, covering the audited standalone and consolidated financial statements and results along with the auditor's report. The transcript of the analyst meet was subsequently filed with the stock exchanges on May 6, 2026, by Company Secretary & Compliance Officer Punam Dargar (Membership No.: A56987).
| Meeting Details: | Information |
|---|---|
| Board Meeting Date: | April 30, 2026 |
| Board Meeting Start Time: | 09:30 A.M. (IST) |
| Board Meeting End Time: | 10:28 A.M. (IST) |
| Analyst Meet Start Time: | 04:00 P.M. (IST) |
| Analyst Meet End Time: | 05:05 P.M. (IST) |
| Transcript Filing Date: | May 6, 2026 |
| Auditor Opinion: | Unmodified |
| Statutory Auditor: | Deloitte Haskins & Sells LLP |
| Transcript Availability: | www.smartworksoffice.com/investors/ |
FY26 Financial Performance Highlights
The company achieved three significant milestones during the fiscal year, becoming the first listed flexible workspace platform in India to cross 10 million square feet of operational area, delivering its first full year of reported PAT profitability at ₹11 crore versus a loss of ₹63 crore in FY25, and crossing contracted rental revenue of ₹5,200 crore. The return on capital employed (ROCE) improved substantially to 16.0% from 7.3% in FY25.
| Financial Performance: | FY26 | FY25 | YoY Growth |
|---|---|---|---|
| Revenue from Operations: | ₹1,796 Cr | ₹1,374 Cr | 31% |
| Normalised EBITDA: | ₹314 Cr | ₹180 Cr | 75% |
| EBITDA Margin: | 17.5% | 13.1% | 440 bps |
| Reported PAT: | ₹11 Cr | (₹63 Cr) | Positive |
| ROCE: | 16.0% | 7.3% | 870 bps |
Q4 FY26 Quarterly Performance
The fourth quarter marked the strongest performance in company history, with revenue from operations reaching ₹520 crore, up 45% year-on-year and 10% quarter-on-quarter. Normalised EBITDA for Q4 stood at ₹99 crore, up 71% year-on-year with margin at 19.0%, representing a 290 basis points expansion. The company reported PAT of ₹17 crore for the quarter, marking the second consecutive quarter of reported profitability.
| Q4 Performance: | Q4 FY26 | Q4 FY25 | YoY Growth |
|---|---|---|---|
| Revenue: | ₹520 Cr | ₹359 Cr | 45% |
| EBITDA: | ₹99 Cr | ₹58 Cr | 71% |
| EBITDA Margin: | 19.0% | 16.1% | 290 bps |
| PAT: | ₹17 Cr | (₹71 Cr) | Positive |
Operational Milestones and Market Position
The company's total footprint reached 16.1 million square feet including letters of intent and term sheets across 66 centres in 15 cities including Singapore, representing 37% year-on-year growth. Operational area stood at 10.1 million square feet, making it the first listed flex platform in India to cross this milestone. Mature centre occupancy remained strong at 89%, with committed mature occupancy at 93% and overall occupancy at 82%.
The enterprise client base expanded to 770+ clients with 90%+ of rental revenue coming from enterprise clients. Multi-city client revenue accounted for approximately 31% of rental revenue, while the top 10 client concentration has halved over seven years from 39% in FY19 to 20% in FY26.
Capital Structure and Future Outlook
Smartworks closed FY26 with a net debt-negative position of ₹56 crore net cash, ending the year with cash and bank balances exceeding gross debt. Contracted rental revenue exceeding ₹5,200 crore provides multi-year forward visibility, covering approximately 82.5% of projected revenue for FY27. The company has secured 100% of FY27 supply visibility and approximately 75% visibility for FY28, positioning it well for sustained growth.
Historical Stock Returns for Smartworks Coworking Spaces
| 1 Day | 5 Days | 1 Month | 6 Months | 1 Year | 5 Years |
|---|---|---|---|---|---|
| +0.26% | +4.03% | +2.33% | +9.71% | +14.33% | +8.43% |
With 100% FY27 supply visibility and ~75% for FY28, what specific expansion strategies is Smartworks pursuing to sustain its 30%+ revenue growth trajectory beyond FY28?
How might Smartworks leverage its net cash-positive position of ₹56 crore to accelerate international expansion beyond Singapore into other Asian markets?
As the first listed flex workspace platform in India to cross 10 million sq ft, how could Smartworks' profitability milestone influence competitor IPO plans and reshape the flexible workspace industry's valuation benchmarks?
 19
19