

Saurashtra Cement net profit falls 45% in Q1FY27 as costs rise


Saurashtra Cement reported a 45% drop in Q1FY27 net profit to ₹92.0 million, driven by rising operational costs that compressed EBITDA margins to 4.55%. Revenue grew 8% to ₹456.7 million, but increased expenses in stores and repairs eroded profitability.


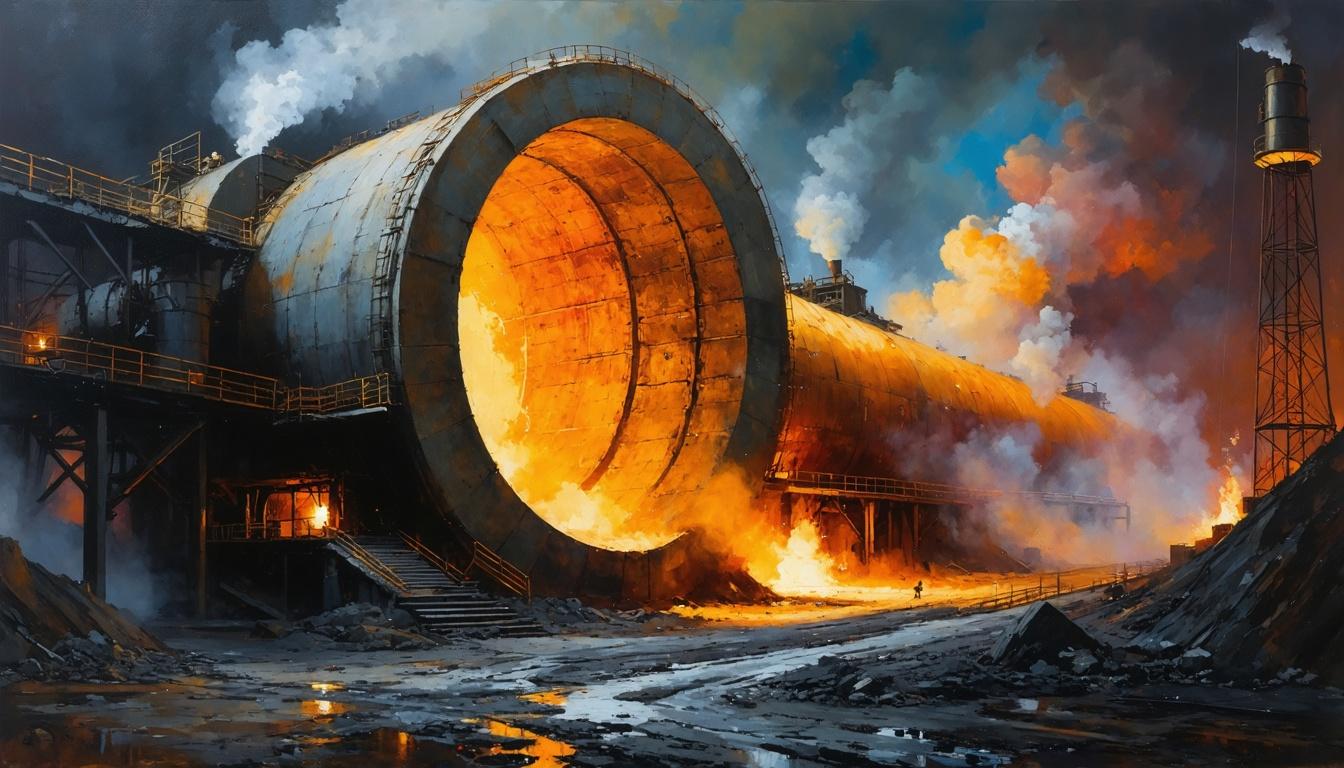
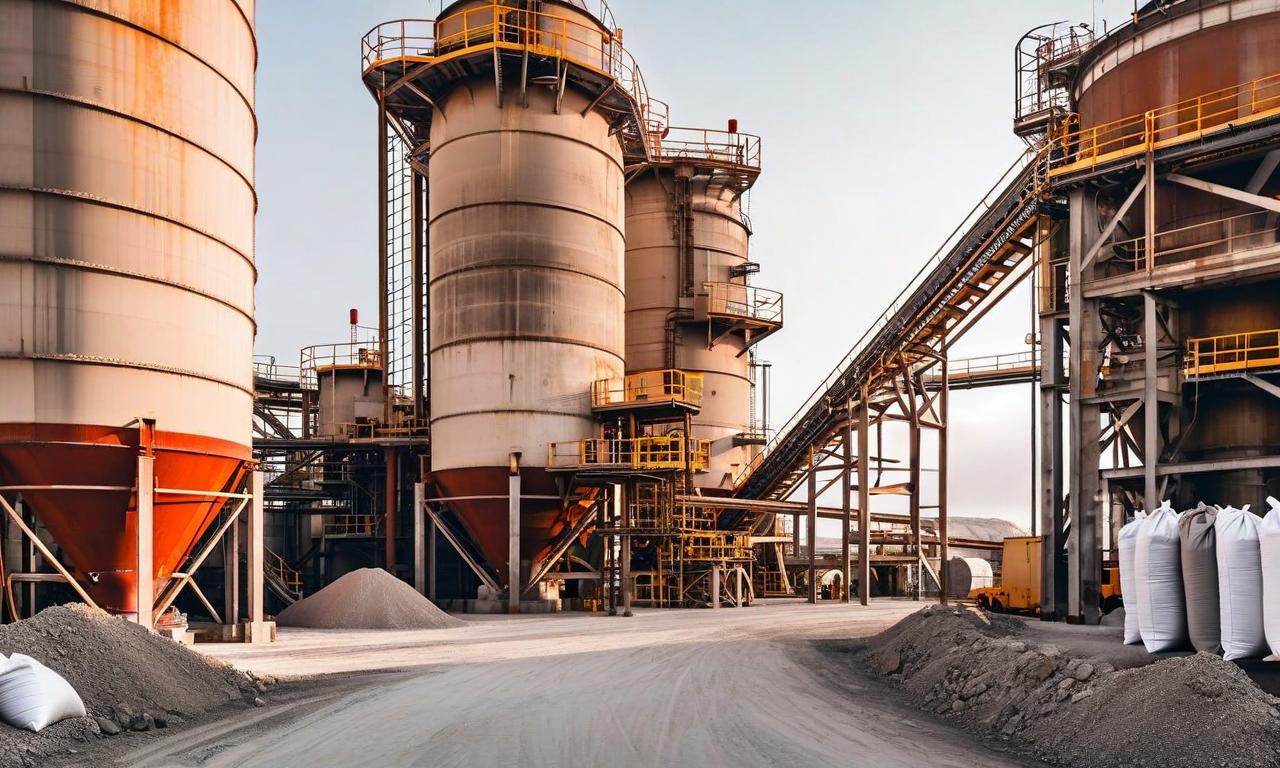
*this image is generated using AI for illustrative purposes only.
Saurashtra Cement reported a sharp decline in profitability for the first quarter of FY27, with standalone net profit dropping 45% year-on-year to ₹92.0 million, despite an 8% increase in revenue from operations. The Board of Directors approved the unaudited financial results on August 6, 2026, revealing that rising operational costs significantly compressed margins during the quarter ended June 30, 2026. This divergence between top-line growth and bottom-line contraction highlights intensifying cost pressures within the cement sector.
Financial Performance Overview
The company’s revenue from operations grew to ₹456.7 million in Q1FY27, up from ₹423.6 million in the corresponding quarter of the previous year. However, this top-line growth was offset by a steep contraction in operating efficiency. Standalone EBITDA fell 40% to ₹208.0 million compared to ₹347.0 million in Q1FY26, leading to an EBITDA margin compression to 4.55% from 8.2%. Consolidated net profit also declined to ₹91.3 million from ₹168.5 million year-on-year.
| Metric | Q1FY27 (₹ in lakhs) | Q1FY26 (₹ in lakhs) | YoY Change |
|---|---|---|---|
| Revenue from Operations | 45,674.50 | 42,356.59 | +7.8% |
| Net Profit | 920.01 | 1,679.14 | -45.2% |
| EPS (Basic) | ₹0.83 | ₹1.51 | -45.0% |
Segment-Wise Analysis
The cement segment remained the primary profit driver, generating segment revenue of ₹433.7 million, up 7.5% from ₹403.4 million in Q1FY26. However, the segment result before finance costs and tax decreased to ₹243.4 million from ₹333.1 million, indicating margin pressure within the core business. Conversely, the paints segment recorded a higher loss of ₹93.6 million compared to ₹41.8 million in the prior year quarter. Total segment assets stood at ₹16,513.2 million, reflecting capital intensity in the cement operations.
Cost Dynamics and Taxation
Operating expenses rose sharply, particularly in stores and repairs (₹382.7 million vs ₹281.5 million) and employee benefit expenses (₹283.4 million vs ₹297.4 million). Finance costs increased to ₹29.5 million from ₹26.2 million. Current tax expense was ₹32.4 million, while deferred tax credit of ₹4.1 million provided some relief against the current tax liability. The subsidiary, Agrima Consultants International Limited, contributed a negligible loss of ₹0.07 million, which management stated was not material to the group.
What the Numbers Show
The divergence between revenue growth and profit decline highlights significant cost inflation impacting Saurashtra Cement’s operational leverage. While sales volume or pricing likely supported the 8% revenue uptick, the inability to pass on increased input costs—evident in the soaring stores and repairs and stable yet high employee costs—eroded profitability. The paints segment’s widening losses further weighed on the bottom line, suggesting ongoing challenges in achieving breakeven in this diversified unit.
Historical Stock Returns for Saurashtra Cement
| 1 Day | 5 Days | 1 Month | 6 Months | 1 Year | 5 Years |
|---|---|---|---|---|---|
| +2.13% | -1.34% | -7.40% | -18.35% | -52.01% | -56.71% |

What specific operational strategies is Saurashtra Cement implementing to mitigate rising input costs and restore EBITDA margins in the coming quarters?
How does the widening loss in the paints segment impact the company's long-term diversification strategy, and are there plans to restructure or divest this unit?
Will Saurashtra Cement consider passing on increased costs to consumers through price hikes, or will it absorb the pressure to maintain market share amid sector-wide cost inflation?
 19
19







 Access 50+ Readymade Screeners
  Use 200+ Custom Filters
  Get Full Market Insights





