

Neochem Bio Solutions FY26 revenue rises 32% to INR110.7 crore


Neochem Bio Solutions Limited reported a 32% year-on-year increase in revenue from operations to INR110.7 crore for FY26. Profit after tax surged 62% to INR12 crore, driven by a favorable product mix and higher capacity utilization. EBITDA margins expanded by 321 basis points to 20.4%.



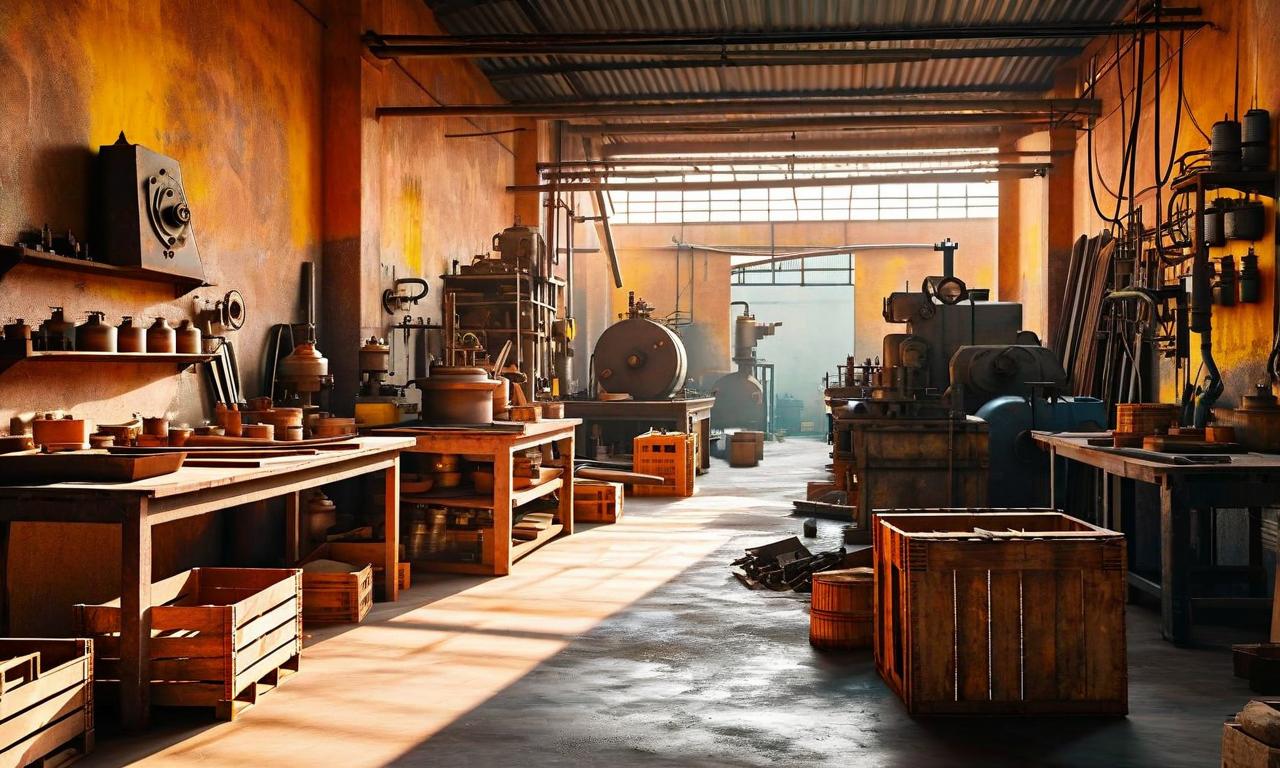
*this image is generated using AI for illustrative purposes only.
Neochem Bio Solutions Limited reported a 32% year-on-year increase in revenue from operations to INR110.7 crore for the financial year ended March 31, 2026. Profit after tax surged 62% to INR12 crore, driven by a favorable product mix, higher capacity utilization, and operating leverage benefits. EBITDA for the year increased by 53% to INR22.6 crore, with margins expanding by 321 basis points to 20.4%.
The company’s strategic shift towards its own brand business, which now constitutes over 80% of operations compared to 75% white-label business in FY22, underpinned the profitability improvement. Total income for FY26 stood at INR113.4 crore, reflecting a 32% growth. The board attributed the strong performance to deepened customer relationships and an expanded specialty product portfolio.
Operational Performance
Neochem’s integrated manufacturing facility at Moraiya, Ahmedabad, operates with an installed capacity of 22,000 metric tons per annum. Capacity utilization improved steadily from approximately 35% in FY24 to 53% in FY26. The company noted that nearly 47% capacity headroom remains available within the existing facility, providing embedded growth potential without requiring major manufacturing capex in the near term.
Financial Highlights
| Metric | FY26 Value | YoY Growth |
|---|---|---|
| Revenue from operations | INR110.7 crore | 32% |
| Total income | INR113.4 crore | 32% |
| EBITDA | INR22.6 crore | 53% |
| EBITDA margin | 20.4% | 321 bps expansion |
| Profit after tax | INR12 crore | 62% |
| PAT margin | 10.6% | 197 bps expansion |
The second half of the fiscal year contributed significantly, with H2 FY26 revenue from operations standing at INR64.9 crore, a 37% increase year-on-year. EBITDA for H2 was INR12.6 crores, translating to a margin of 19.4%, while PAT for the period was INR6.9 crores.
Strategic Developments
The Home and Personal Care (HPC) segment grew to contribute 14% of revenue in FY26, up from 2% in FY24. The company also commercialized its partnership with Lamoral Coatings from the Netherlands, focusing on bio-based fluorine-free water and stain repellent technology. Exports accounted for approximately 5% of revenue in FY26, with a presence across 12 countries including Bangladesh, Vietnam, and Canada.
Balance Sheet Strength
FY26 witnessed a substantial strengthening of the balance sheet, with long-term borrowings reduced to INR0.7 crore from INR14.3 crore in FY25. The debt-to-equity ratio improved significantly from 1.8 in FY25 to 0.2 in FY26. Short-term borrowings stood at INR17.1 crore, primarily comprising working capital facilities.
Historical Stock Returns for Neochem Bio Solutions
| 1 Day | 5 Days | 1 Month | 6 Months | 1 Year | 5 Years |
|---|---|---|---|---|---|
| 0.0% | -7.28% | -4.19% | +40.50% | -10.02% | -10.02% |

What is the company's target timeline for utilizing the remaining 47% capacity headroom?
How will the partnership with Lamoral Coatings contribute to export growth beyond the current 5% of revenue?
What are the strategic plans to further increase the Home and Personal Care segment's 14% revenue contribution?
 19
19







 Create Custom Screeners
  Access 200+ Pre-built Filters
  Use 50+ Readymade Screener





