

MOIL logs 15.5% YoY jump in September manganese ore sales


- September 2026 sales rose 15.5% YoY to 1.64 lakh MT
- Production increased 19.1% YoY to 1.81 lakh MT
- Cumulative H1FY27 sales reached 7.78 lakh MT, up from 7.10 lakh MT
- Monthly growth outpaced cumulative H1FY27 sales growth of 9.6%



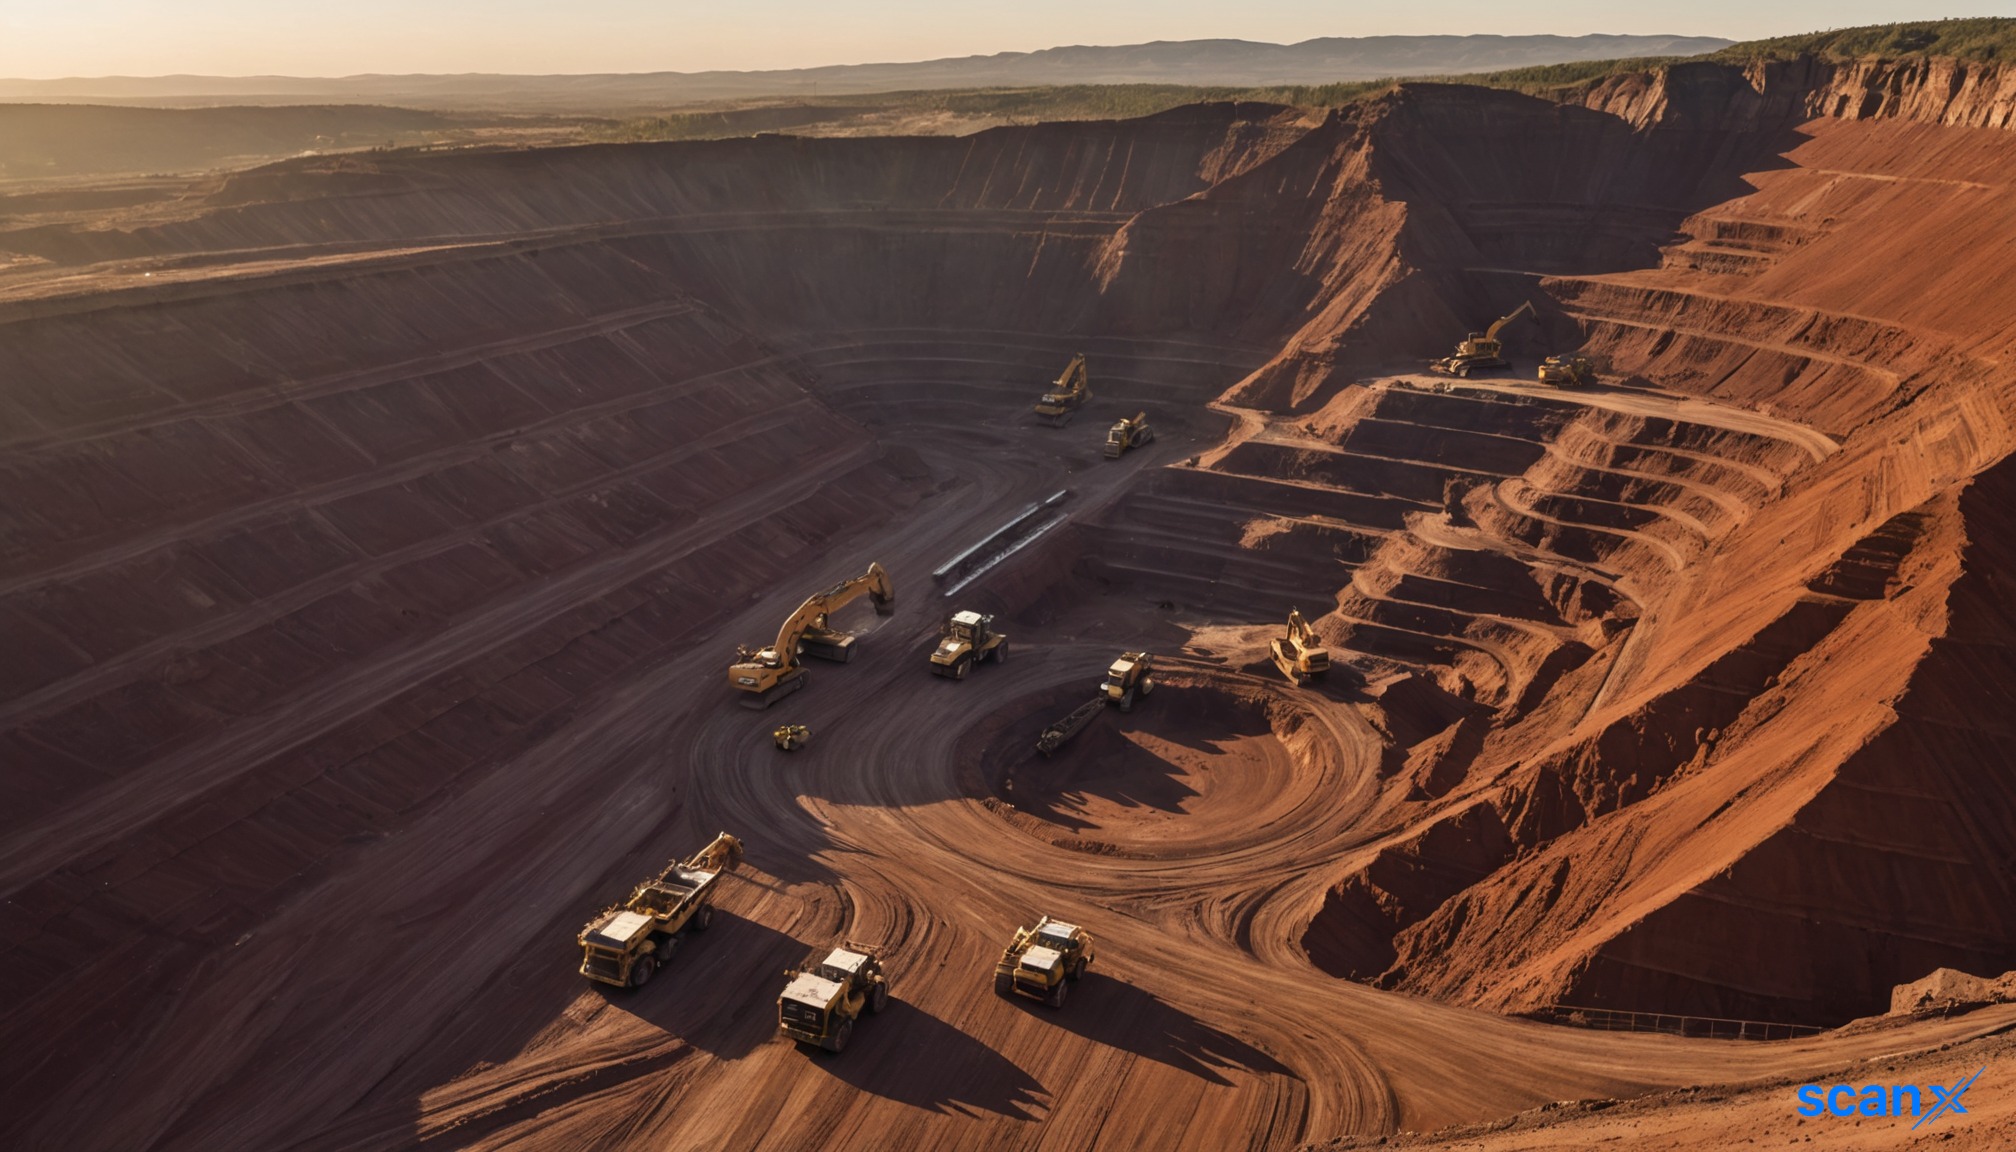
*this image is generated using AI for illustrative purposes only.
MOIL Limited reported provisional manganese ore sales of 1.64 lakh MT in September 2026, marking a 15.5% year-on-year increase from 1.42 lakh MT in the corresponding period last year. Production for the month stood at 1.81 lakh MT, up 19.1% from 1.52 lakh MT in September 2025.
The state-owned miner disclosed these figures in a filing to stock exchanges on October 3, 2026, under Regulation 30 of SEBI (LODR) Regulations, 2015. The data covers performance for and up to September 2026 within the FY26 fiscal year (April 2026 to March 2027).
Monthly production and sales metrics
The company demonstrated improved operational throughput in September 2026 compared to the previous year. Both production and sales volumes expanded significantly, indicating stronger demand absorption alongside higher output capacity utilization.
| Metric | Sept 2026 | Sept 2025 | Change |
|---|---|---|---|
| Production (lakh MT) | 1.81 | 1.52 | +19.1% |
| Sales (lakh MT) | 1.64 | 1.42 | +15.5% |
Cumulative FY27 performance
For the first six months of FY27 (April to September 2026), MOIL logged cumulative production of 9.61 lakh MT, a modest increase from 9.44 lakh MT in the same period of FY26. Cumulative sales rose to 7.78 lakh MT in FY27, up from 7.10 lakh MT in FY26.
The company has set a production target of 25.85 lakh tonnes for the full FY27. The current pace suggests a steady trajectory toward meeting annual goals, with H1FY27 production accounting for approximately 37% of the annual target.
What the numbers show
A notable divergence exists between monthly momentum and cumulative growth. While September 2026 sales surged 15.5% YoY, cumulative FY27 sales grew only 9.6% YoY (from 7.10 to 7.78 lakh MT). This indicates that recent monthly gains are outpacing the average growth rate seen earlier in the fiscal year, potentially signaling accelerating demand or improved logistics efficiency in the latter half of the reporting period.
Historical Stock Returns for MOIL
| 1 Day | 5 Days | 1 Month | 6 Months | 1 Year | 5 Years |
|---|---|---|---|---|---|
| -2.15% | -6.45% | -9.91% | -17.86% | -37.17% | +42.21% |

How will the widening gap between production and sales volumes in September impact MOIL's inventory levels and working capital requirements in the coming quarters?
What specific infrastructure or logistical improvements are driving the accelerated sales growth in the second half of FY27 compared to the first half?
Given that H1 production is only 37% of the annual target, what operational risks or seasonal factors could hinder MOIL's ability to meet its 25.85 lakh tonne goal for FY27?















 Create Custom Screeners
  Access 200+ Pre-built Filters
  Use 50+ Readymade Screener





