

Mahamaya Lifesciences FY26 Results: Net profit up 29% to ₹16.52 crore


- Revenue from operations rose 24.5% YoY to ₹328.87 crore in FY26
- Consolidated PAT increased 29.0% to ₹16.52 crore, up from ₹12.81 crore
- EBITDA margin expanded to 10.42% from 9.78%, reflecting operational leverage
- IPO proceeds strengthened balance sheet, reducing debt-to-equity to 0.74x

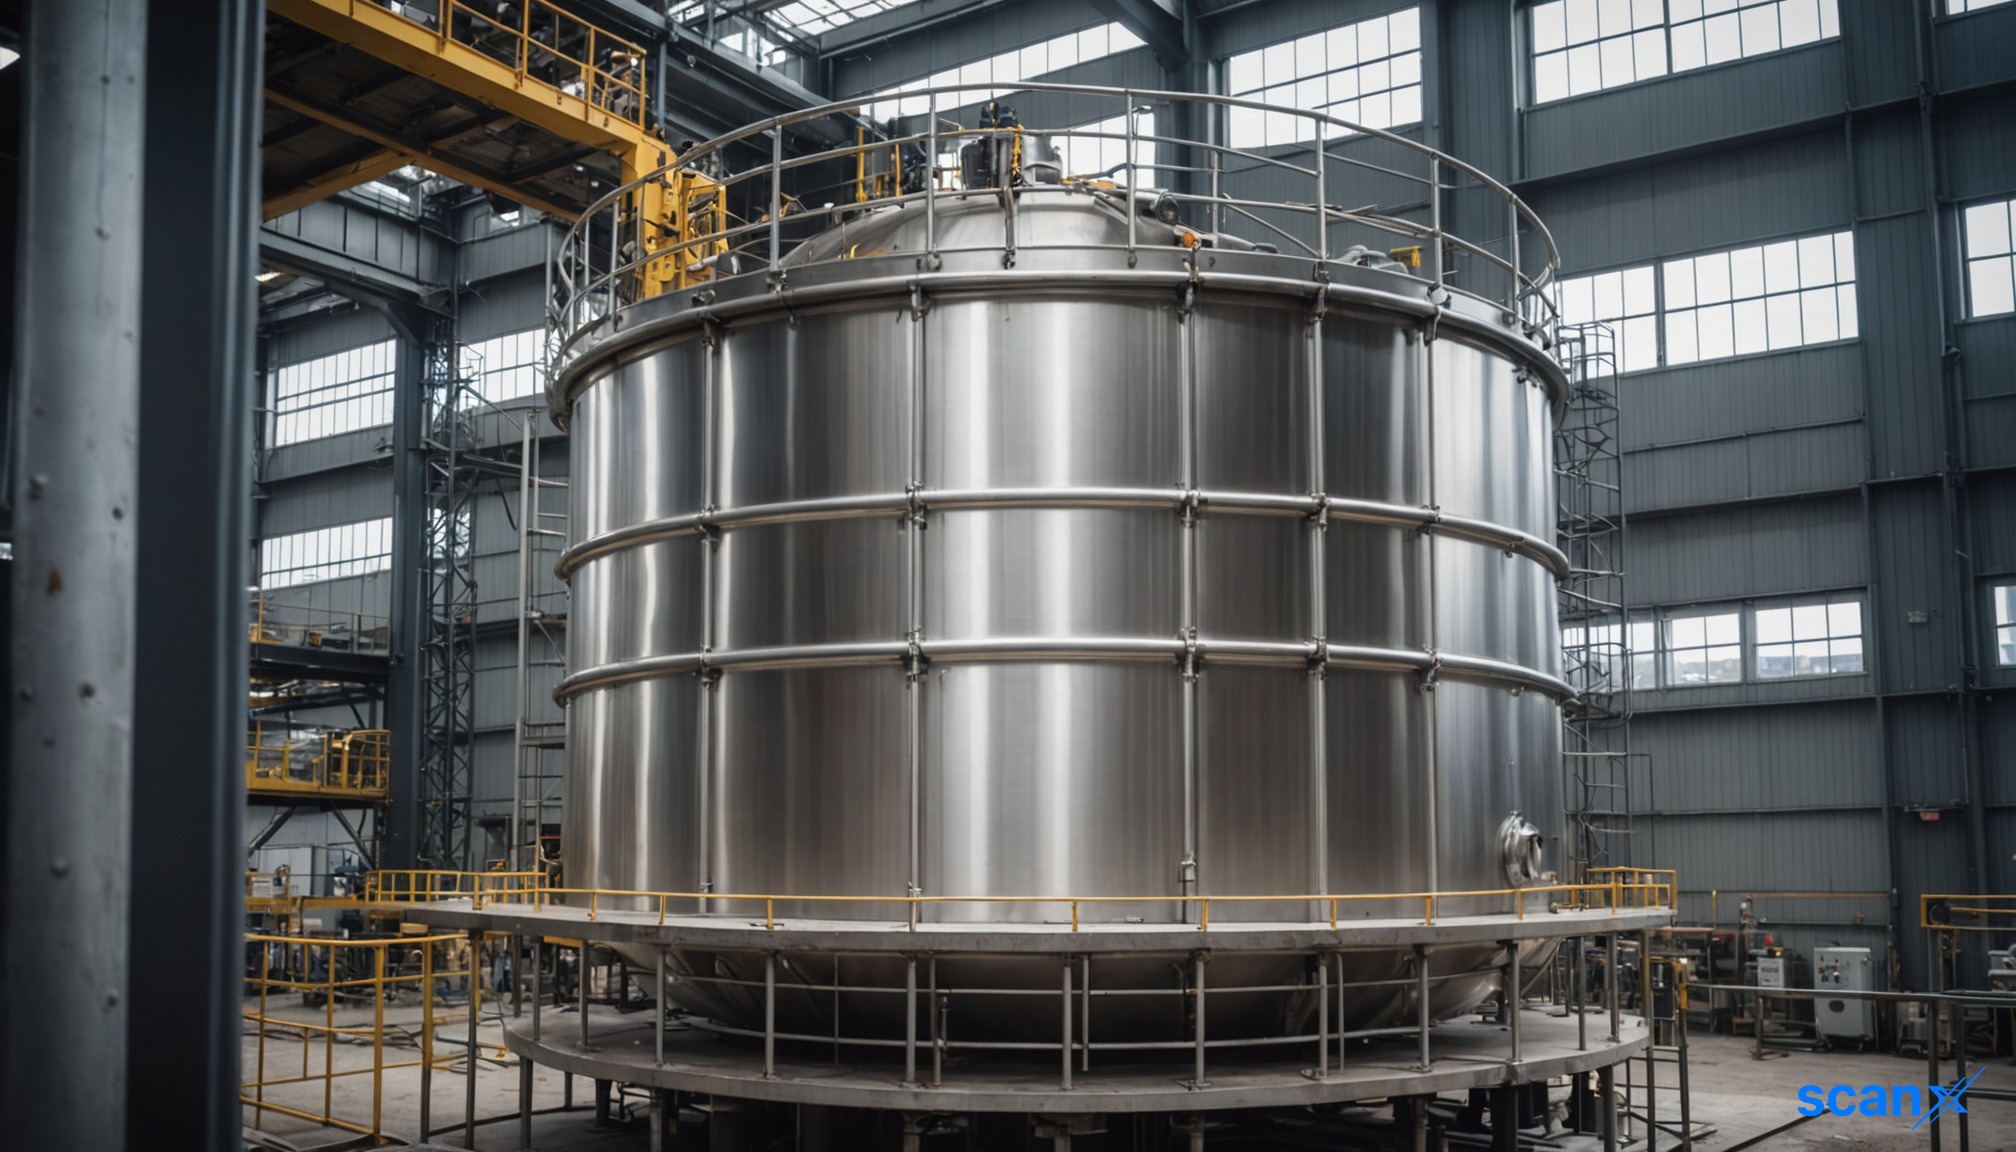

*this image is generated using AI for illustrative purposes only.
Mahamaya Lifesciences reported a 24.5% year-on-year increase in revenue from operations to ₹328.87 crore for the financial year ended March 31, 2026. The agrochemical manufacturer also saw its consolidated profit after tax (PAT) rise 29.0% to ₹16.52 crore, driven by strong operational execution and margin expansion.
The company’s EBITDA grew 32.6% to ₹34.26 crore, with the EBITDA margin expanding to 10.42% from 9.78% in the previous fiscal. This improvement occurred alongside a 24.5% revenue growth, indicating effective cost management and operational leverage during the period.
Financial Performance
Mahamaya Lifesciences posted a profit before tax (PBT) of ₹23.87 crore, up 38.4% from ₹17.25 crore in FY25. The basic earnings per share (EPS) improved to ₹8.33 from ₹7.52 in the prior year. The company retained the entire profit for the year, declaring no dividend.
| Metric | FY26 | FY25 | Change |
|---|---|---|---|
| Revenue from Operations | ₹328.87 crore | ₹264.14 crore | +24.5% |
| EBITDA | ₹34.26 crore | ₹25.83 crore | +32.6% |
| EBITDA Margin | 10.42% | 9.78% | Expansion |
| Profit After Tax | ₹16.52 crore | ₹12.81 crore | +29.0% |
| Basic EPS | ₹8.33 | ₹7.52 | +10.8% |
Balance Sheet Strengthening
The company listed on the BSE SME Platform in November 2025 through an Initial Public Offering (IPO). The fresh issue raised ₹64.28 crore, significantly strengthening the balance sheet. Shareholders’ funds increased to ₹12,192.99 lakh, while the net debt-to-equity ratio improved to 0.74x from 1.18x in the previous year. Cash and cash equivalents rose sharply to ₹393.99 lakh from ₹39.95 lakh.
What the Numbers Show
The divergence between revenue growth (24.5%) and EBITDA growth (32.6%) highlights improved operating efficiency. While finance costs rose 19.7% to ₹8.14 crore due to higher borrowings supporting expansion, the company maintained robust interest coverage. The significant drop in other income (down 61.9% to ₹1.15 crore) underscores that the PAT growth was driven primarily by core operational performance rather than non-recurring gains.
Strategic Outlook
Management highlighted the favourable industry outlook and the company’s transition into a publicly listed entity as key milestones. Strategic priorities include expanding manufacturing capabilities at its Dahej facility, developing active-ingredient process development, and deepening international market presence. The company plans to utilize unutilized IPO proceeds for technical manufacturing plants and formulation facility expansions.
Historical Stock Returns for Mahamaya Lifesciences
| 1 Day | 5 Days | 1 Month | 6 Months | 1 Year | 5 Years |
|---|---|---|---|---|---|
| 0.0% | -0.03% | -0.41% | +16.47% | +56.03% | +56.03% |

How will the expansion of the Dahej facility impact Mahamaya Lifesciences' production capacity and cost structure in the next 12-18 months?
What specific international markets is the company targeting to deepen its presence, and what regulatory hurdles might it face?
Given the rise in finance costs, how does management plan to further reduce the net debt-to-equity ratio below the current 0.74x level?
 17
17









 Access Market Heat-map & Insights
  Create, Save & Share your Screener
  Use 200+ Screening Filters





