

Kp Green Engineering wins Rs 258.02 crore order from various clients


- Kp green engineering wins a confirmed Rs 258.02 crore order from various clients for solar and transmission projects.
- Order inflow has been strong, with Rs 507.94 crore in Q1FY27 and Rs 239.61 crore in Q2FY27.
- Annual revenue grew by 77.4% in FY26 to Rs 1245.57 crore, showing effective execution.
- Current ratio of 0.94x and total liabilities/equity of 2.47x highlight working capital pressures.
- Valuation as of 28 Aug 2026 shows a P/E of 9.6x against a ROCE of 30.96%.

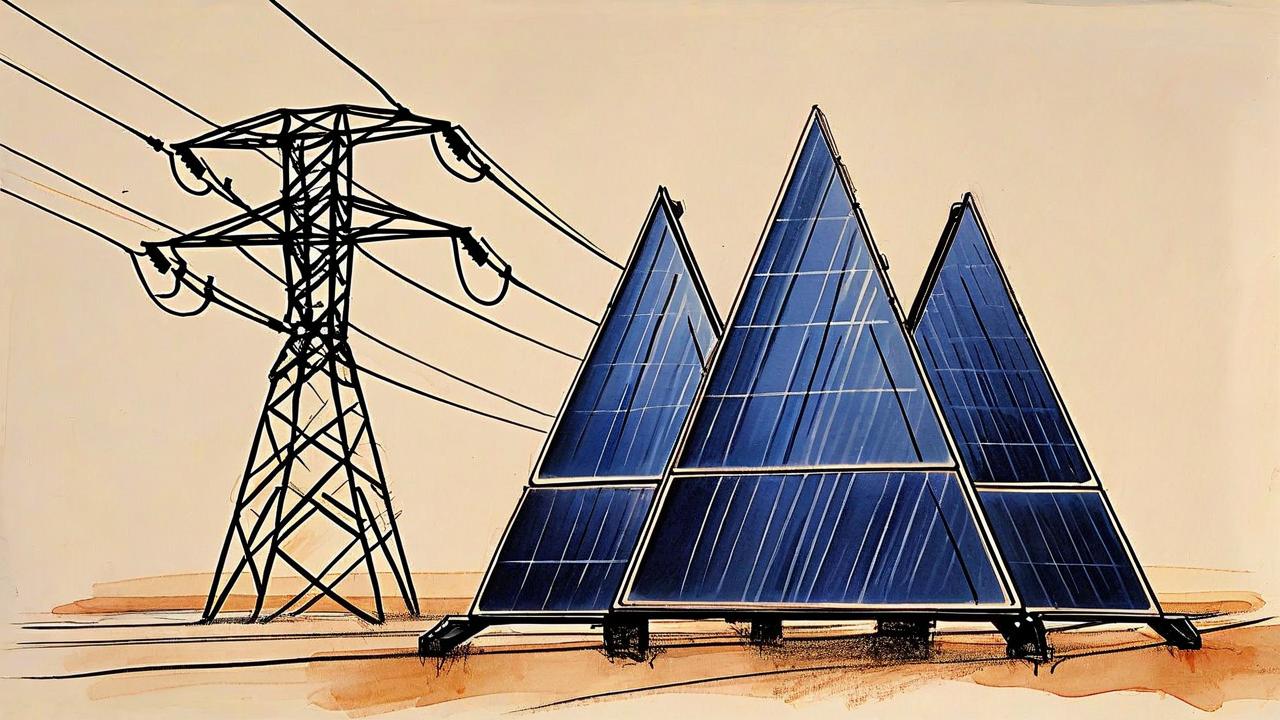

*this image is generated using AI for illustrative purposes only.
Kp Green Engineering has secured a confirmed work order valued at Rs 258.02 crore from various esteemed clients. The contract encompasses solar projects, crash barriers, pre-engineered buildings, and transmission infrastructure.
WHAT HAPPENED
Kp green engineering received a confirmed work order worth Rs 258.02 crore from various esteemed clients for solar, transmission, and PEB projects on 28 August 2026.
ORDER IN FINANCIAL CONTEXT
The Rs 258.02 crore order represents a significant addition to the company's pipeline. While the average quarterly revenue figure is not explicitly provided in the input, the order value is substantial relative to the firm's recent quarterly performance. The total disclosed order book, summing the last three fiscal quarters shown in the table below, provides a clear view of near-term revenue visibility. This confirmed order adds to the existing backlog, reinforcing the company's position in the capital goods sector. The book-to-bill ratio cannot be calculated precisely without the trailing twelve-month revenue figure, but the consistent inflow suggests a healthy demand environment.
COMPANY ORDER TRACK RECORD
Order inflow velocity appears stable with large-ticket orders being secured consistently. The current order value is consistent with the company's typical per-order size visible in the history, indicating sustained demand across its diversified segments.
| Quarter | Total Order Inflow (Rs Cr) | Key Awarding Entities |
|---|---|---|
| Q2FY27 (Jul-Sep 2026) | 239.61 | Multiple esteemed clients |
| Q1FY27 (Apr-Jun 2026) | 507.94 | Various clients |
EXECUTION AND REVENUE QUALITY
The company has demonstrated strong profitability in recent years. However, specific quarterly revenue and net profit data for the last three quarters are not available in the provided input. The annual data shows consistent growth in operating profit margins, rising from 12.13% in FY22 to 19.65% in FY26.
REVENUE GROWTH - ORDER WINS TRANSLATING TO REVENUE
As Kp green engineering has sustained order wins, with inflows of Rs 507.94 crore in Q1FY27 and Rs 239.61 crore in Q2FY27, its annual revenue has grown from Rs 702.00 crore in FY25 to Rs 1245.57 crore in FY26, representing a YoY growth of +77.4% based on the latest annual data.
WORKING CAPITAL AND EXECUTION CAPACITY
The balance sheet shows a current ratio of 0.94x, which is below the typical comfort zone of 1.2x, indicating potential liquidity tightness. Total liabilities/equity stands at 2.47x, reflecting elevated leverage that includes trade payables and other non-debt liabilities. Operating cashflow was positive at Rs 19.10 crore in FY25, but free cashflow remained negative at -Rs 164.90 crore due to high capex of Rs 184.00 crore, suggesting significant reinvestment in capacity.
WHAT TO WATCH
- Execution rate: Monitor how quickly the new Rs 258.02 crore order converts into revenue against the historical run-rate.
- Margin quality: Track the operating profit margin on these new orders compared to the historical average of 19.65% in FY26.
- Liquidity management: With a current ratio of 0.94x, watch for any changes in working capital cycles or additional funding requirements.
- Client concentration: Assess the distribution of orders among "various esteemed clients" to gauge dependency risks.
KEY OBSERVATIONS
- Leverage flag: Total Liabilities/Equity of 2.47x; balance sheet carries elevated liabilities, and ability to fund working capital for the existing backlog should be monitored.
- Valuation check (as of 28 Aug 2026): P/E of 9.6x against ROCE of 30.96%. At the time of this article, valuation was pricing in execution improvement not yet visible in return ratios. (P/E is price-derived and will change; ROCE is from audited financials)
- Cash conversion: Free cashflow of -Rs 164.90 crore in FY25; backlog is not converting to cash efficiently due to high capex, and receivables or working capital cycle may be stretched.
Historical Stock Returns for KP Green Engineering
| 1 Day | 5 Days | 1 Month | 6 Months | 1 Year | 5 Years |
|---|---|---|---|---|---|
| +1.37% | +3.03% | +15.46% | -7.35% | -40.88% | +44.05% |

 16
16




 Access 50+ Readymade Screeners
  Use 200+ Custom Filters
  Get Full Market Insights





