

KEI Industries Q1 Results: Net profit surges 40% YoY to ₹2,741 crore


KEI Industries delivered strong Q1 FY27 results with net profit jumping 40% YoY to ₹2,741 crore and revenue rising 23% to ₹31,853 crore. EBITDA margins expanded to 13.04%, driven by operational efficiency and favorable product mix. The company maintains a healthy export order book of ₹8,216 crore and benefits from robust industry tailwinds in power and infrastructure.


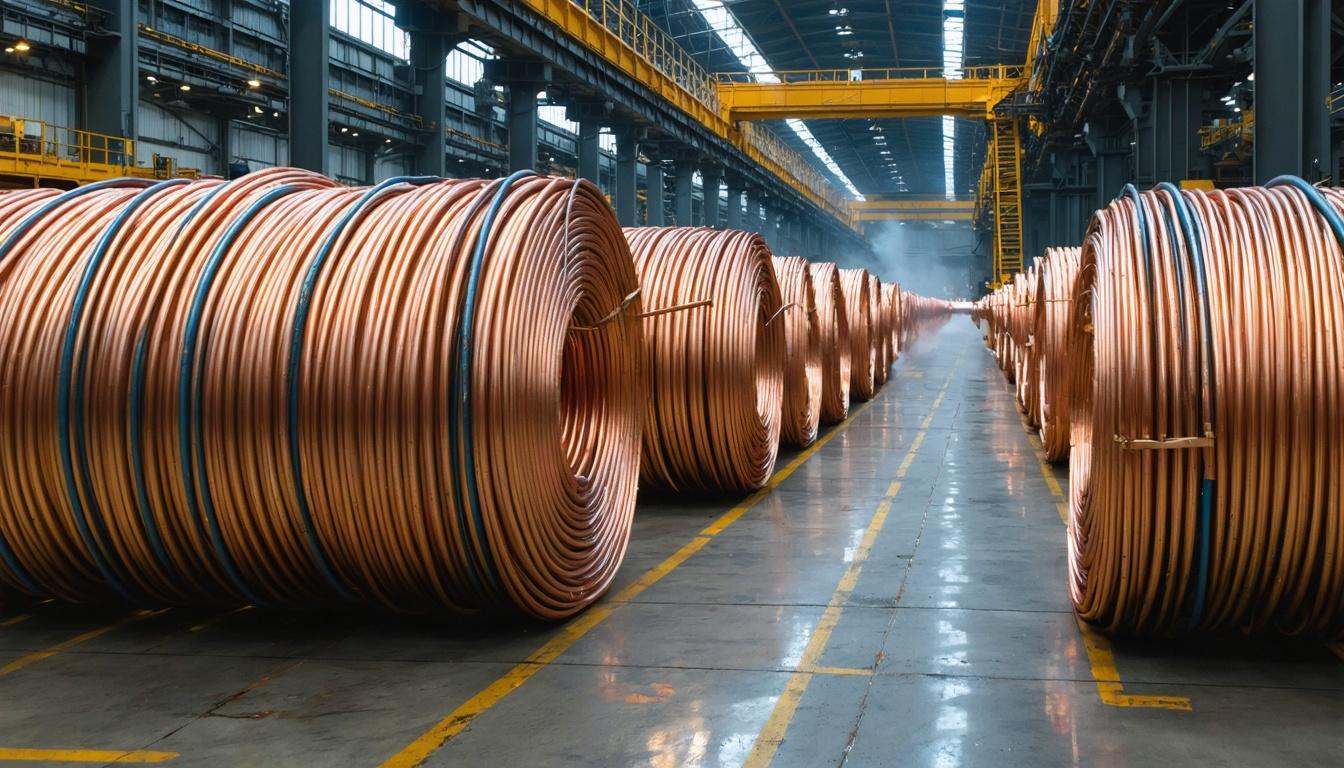
*this image is generated using AI for illustrative purposes only.
KEI Industries reported a significant acceleration in profitability during the first quarter of fiscal year 2027, with net profit after tax (PAT) rising 40.05% year-on-year to ₹2,741 crore. The growth was underpinned by a 22.97% increase in net sales to ₹31,853 crore and a substantial expansion in operating margins, signaling strong execution across its wires and cables portfolio. This performance reflects broad-based demand across key sectors including power transmission, railways, and real estate, alongside improved operational efficiency.
The company’s earnings per share benefited from a wider profit cushion, as the PAT margin expanded to 8.61% in Q1 FY27 from 7.56% in the corresponding period last year. Management attributed the margin improvement to better product mix and enhanced operating efficiencies. The Board highlighted that the strong financial outcome was consistent with the company’s strategy to scale exports and grow its retail business through an expanded distribution network.
Financial Performance
KEI Industries demonstrated robust top-line and bottom-line growth in Q1 FY27 compared to Q1 FY26. EBITDA surged 39.57% to ₹4,154 crore, driving the EBITDA margin up by approximately 155 basis points to 13.04% from 11.49%. The company maintained a comfortable debt profile with total debt at ₹2,039 crore against net worth of ₹69,401 crore.
| Particulars | Q1 FY26 | Q1 FY27 | YoY Change |
|---|---|---|---|
| Net Sales (₹ Mn) | 25,900 | 31,853 | 22.97% |
| EBITDA (₹ Mn) | 2,976 | 4,154 | 39.57% |
| PAT (₹ Mn) | 1,957 | 2,741 | 40.05% |
| EBITDA Margin (%) | 11.49 | 13.04 | +155 bps |
| PAT Margin (%) | 7.56 | 8.61 | +105 bps |
Note: Q1 FY26 figures derived from disclosed growth percentages.
Operational Highlights
The company continues to leverage its wide product basket, which includes Extra-High Voltage cables up to 400 KV, EV cables, and solar cables, serving diverse industries such as oil & gas, railways, and data centers. KEI Industries reported a healthy order book for cable exports of INR 8,216 Mn as on July 2026. Exports accounted for 15% of sales in FY26, providing a natural hedge against forex fluctuations given the company’s import of raw materials.
Retail penetration remains a key growth driver, with the company maintaining 26 depots and 38 marketing offices across India, along with overseas offices in UAE, South Africa, Nepal, and Gambia. The brand has held Super Brand status consistently from FY 2011-16 and FY 2019-26, supported by extensive marketing activities including IPL sponsorship.
What the Numbers Show
A notable divergence in the balance sheet is the decline in cash reserves despite strong operating cash flows. Cash and bank balances dropped to ₹10,540 crore in Q1 FY27 from ₹15,126 crore in FY26, while inventories rose significantly to ₹31,416 crore from ₹24,008 crore. This suggests aggressive stocking ahead of anticipated demand or supply chain adjustments. Meanwhile, trade receivables decreased to ₹15,792 crore from ₹18,417 crore, indicating improved collection efficiency. The return on capital employed (ROCE) remained stable at 24% in FY26, reflecting efficient utilization of assets despite the increased capital base from recent expansions.
Outlook and Industry Tailwinds
KEI Industries is well-positioned to benefit from India’s infrastructure push, with the wires and cables market projected to grow at a CAGR of 11-13% between FY24 and FY29. Key tailwinds include government investments in power transmission, railway electrification, and the expansion of data centers. The company’s focus on ESG initiatives, including a reduction in GHG intensity and energy intensity, aligns with global sustainability trends, further strengthening its competitive moat.
Historical Stock Returns for KEI Industries
| 1 Day | 5 Days | 1 Month | 6 Months | 1 Year | 5 Years |
|---|---|---|---|---|---|
| -4.25% | -8.62% | -8.54% | -12.12% | +2.95% | +331.43% |

How will the significant rise in inventory levels impact working capital efficiency and cash flow in the upcoming quarters?
What specific strategies is KEI Industries employing to sustain its export growth given the current geopolitical trade dynamics?
To what extent will the expansion of retail distribution networks contribute to overall revenue growth compared to B2B segments in FY27?
 16
16









 Create Custom Screeners
  Access 200+ Pre-built Filters
  Use 50+ Readymade Screener





