

Kaynes Technology revenue jumps 40% in Q1 FY27; profit falls 24%


Kaynes Technology reported Q1 FY27 revenue of ₹9,460 crore, up 40% YoY, driven by strong EMS growth. Net profit fell 24% to ₹564 crore due to margin pressure and higher costs. The company degrew its smart metering business to improve working capital, while OSAT and PCB units remain on track for Q3 FY27 launch.


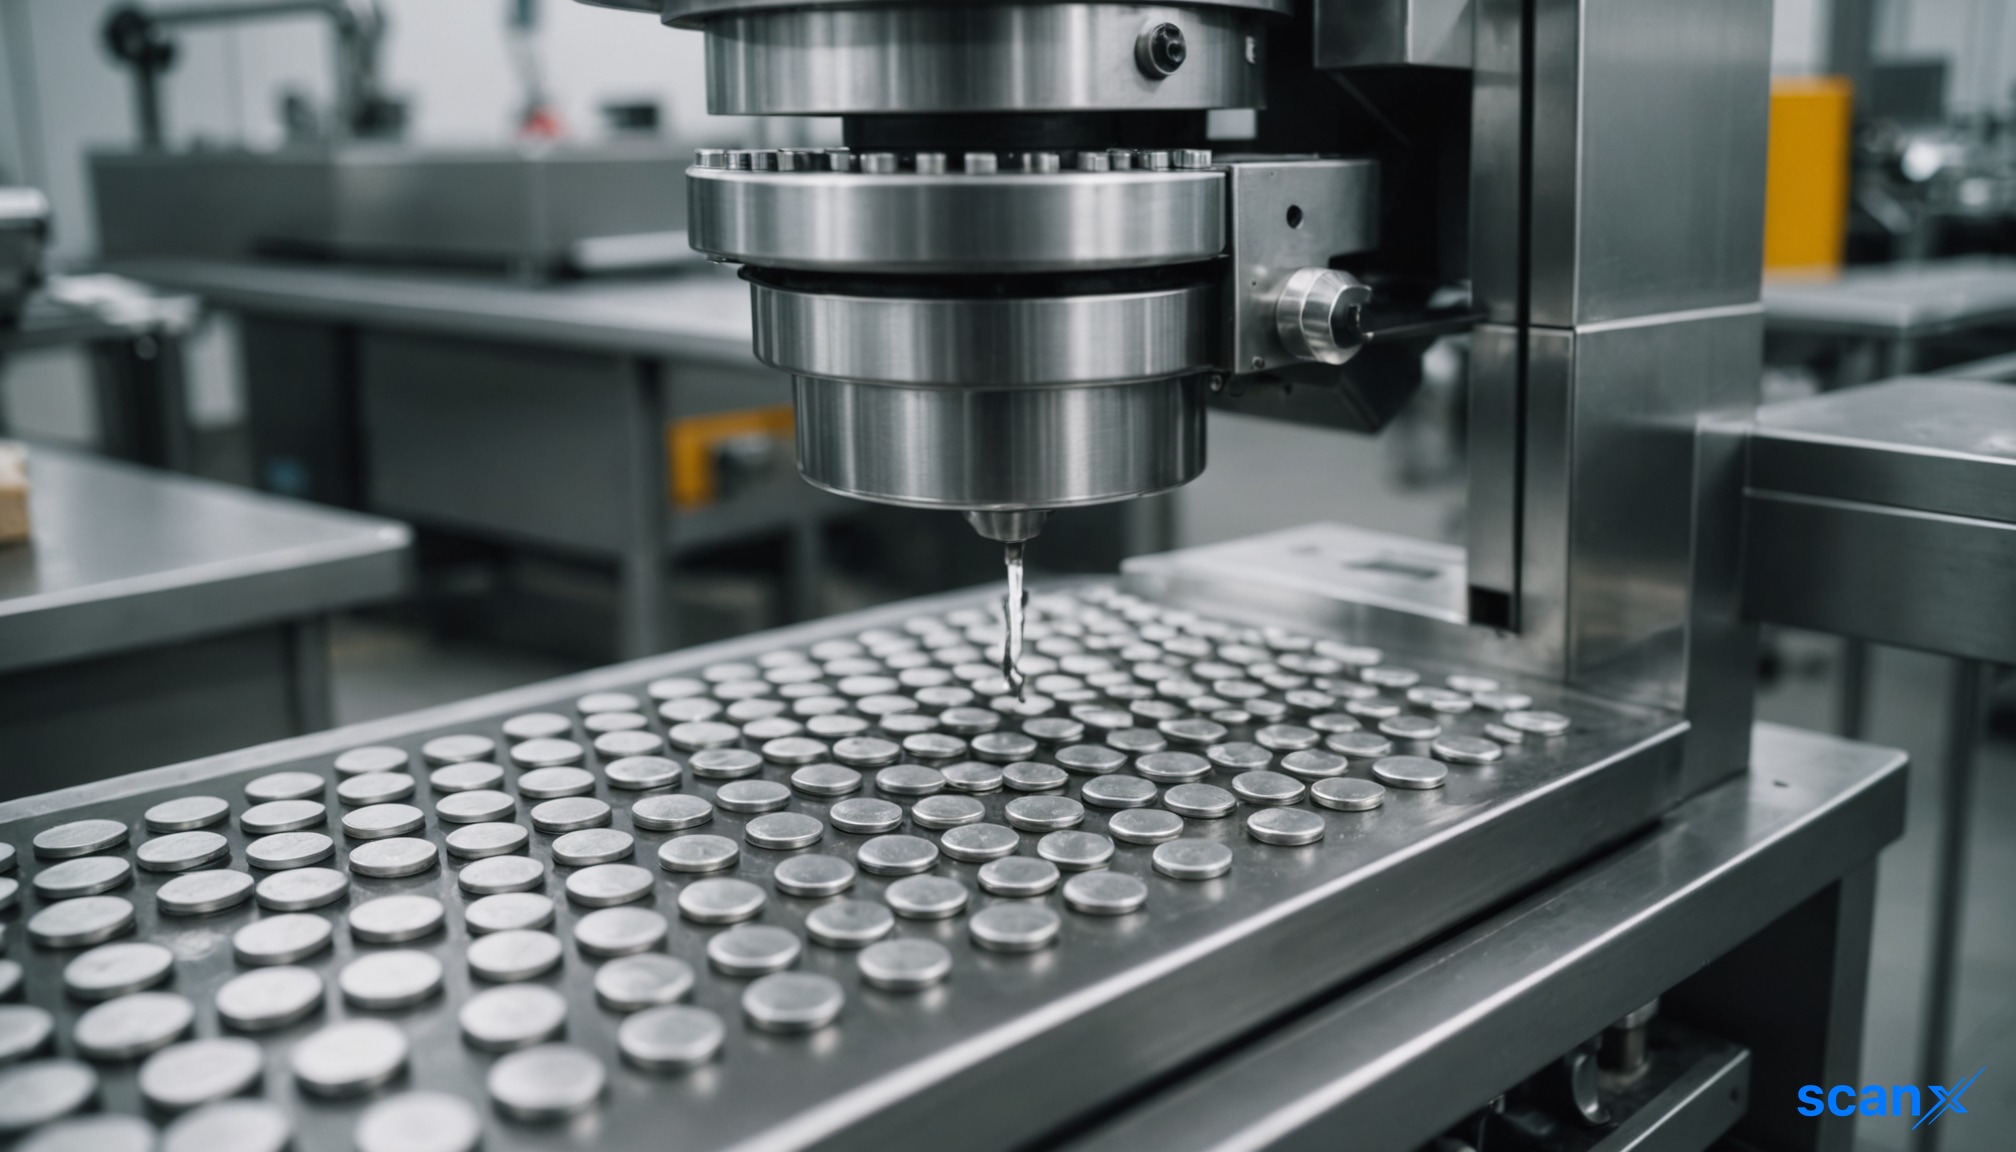
*this image is generated using AI for illustrative purposes only.
Kaynes Technology India reported consolidated revenue of ₹9,460 crore for the quarter ended June 30, 2026 (Q1FY27), marking a 40% year-on-year increase from ₹6,735 crore in Q1FY26. Despite the top-line growth, net profit after tax (PAT) fell 24% to ₹564 crore from ₹746 crore in the corresponding period last year, driven by margin compression and higher raw material and employee expenses. The company’s order book expanded significantly to ₹89,038 crore, up from ₹74,011 crore in Q1FY26, signaling strong future revenue visibility.
The results were disclosed in an investor presentation filed under Regulation 30 of the SEBI (Listing Obligations and Disclosure Requirements) Regulations, 2015, on August 7, 2026. An earnings call held on August 8, 2026, provided further clarity on segment performance and strategic initiatives.
Financial Performance
Revenue growth was broad-based, with the Industrial (including EV) vertical contributing 55% of total revenue, followed by Automotive at 26%. However, profitability metrics showed strain. EBITDA rose 30% to ₹1,476 crore, but the EBITDA margin contracted by 120 basis points to 15.6% from 16.8% in Q1FY26. Net profit margin declined sharply by 510 basis points to 6.0% from 11.1%.
| Metric | Q1FY27 (₹ Cr) | Q1FY26 (₹ Cr) | YoY Change |
|---|---|---|---|
| Revenue | 9,460 | 6,735 | +40% |
| EBITDA | 1,476 | 1,130 | +30% |
| EBITDA Margin | 15.6% | 16.8% | -120 BPS |
| Net Profit After Tax | 564 | 746 | -24% |
| Net Profit Margin | 6.0% | 11.1% | -510 BPS |
| Order Book | 89,038 | 74,011 | +20% |
Cost pressures were evident across key expense lines. Raw material costs surged 57% to ₹6,205 crore, outpacing revenue growth. Employee expenses increased 44% to ₹851 crore, while depreciation and amortization more than doubled to ₹370 crore from ₹156 crore, reflecting ongoing capacity expansion. Finance costs also rose 31% to ₹371 crore.
Segment Breakdown and Working Capital
Management disclosed detailed segment figures during the earnings call. The core EMS business grew 48% to ₹854 crore (including GST), with standalone EMS revenue rising 53% to ₹639 crore from ₹480 crore in Q1FY26. Overseas entities, including the acquired August Electronics, saw revenue jump 327% to ₹102 crore from ₹24 crore. Conversely, the smart metering business degrew 12% to ₹204 crore from ₹231 crore, as management deliberately scaled back production to manage working capital constraints.
Working capital intensity remained high. Net working capital days increased to 163 days from 122 days in Q1FY26. Receivables rose to ₹1,925 crore from ₹1,765 crore at the start of the quarter, with metering receivables increasing from ₹1,158 crore to ₹1,311 crore. Inventory levels also increased strategically by approximately ₹150 crore to mitigate global supply chain disruptions. Cash flow from operations was negative ₹259 crore, an improvement from the negative ₹379 crore recorded in Q1FY26.
Strategic Context and New Initiatives
The presentation highlights global supply chain disruptions due to geopolitical tensions, AI-driven demand shifts, and high raw material prices. Lead times for critical components like MCU & Power Devices extended to 26–52 weeks, with price increases ranging from 15% to 85%. Kaynes is leveraging its diversified portfolio across eight verticals, including Defense, Aerospace, Railways, and Healthcare, to mitigate sector-specific risks.
New customer wins included one of India’s second-largest two-wheeler EV manufacturers, with serial supplies now underway. The company also received performance awards from major clients including Mahindra and Siemens. On the strategic front, Kaynes Semicon and Kaynes Circuit remain on track for commercial operations by Q3 FY27. A partnership with Mitsui will help access the Japanese market for OSAT, while a global EV manufacturer has completed positive trials at the PCB facility. Additionally, Kaynes’ first 3U satellite is in prototype development, with a launch expected mid-next year pending ISRO confirmation.
What the Numbers Show
The divergence between top-line growth and bottom-line profitability underscores the impact of input cost inflation and strategic inventory buildup. While EMS revenue grew 48%, the overall EBITDA margin contracted by 120 bps, indicating that cost pass-through mechanisms are lagging behind raw material price hikes. Furthermore, the deliberate degrowth in the smart metering segment, despite having sufficient order book, signals management’s prioritization of balance sheet health over pure revenue expansion in capital-intensive segments.
Historical Stock Returns for Kaynes Technology India
| 1 Day | 5 Days | 1 Month | 6 Months | 1 Year | 5 Years |
|---|---|---|---|---|---|
| -0.41% | -3.43% | -5.75% | -8.51% | -54.58% | +391.51% |

How will the upcoming commercial operations of Kaynes Semicon and Kaynes Circuit in Q3 FY27 impact the company's margin trajectory given current raw material inflation?
What specific strategies is management employing to reduce net working capital days from 163 to a more sustainable level without compromising order fulfillment?
To what extent can Kaynes pass through the 15-85% price hikes in critical components like MCUs and Power Devices to clients in the near term?
 15
15






 Access Market Heat-map & Insights
  Create, Save & Share your Screener
  Use 200+ Screening Filters





