JBM Auto FY26 Results: Consolidated Revenue ₹6,227.30 Cr, Q4 EV Business Grows 31.35%


JBM Auto Limited published its FY26 audited financial results in newspapers on May 12, 2026, following board approval on May 11, 2026. Consolidated revenue for FY26 stood at ₹6,227.30 crore with net profit after tax of ₹238.01 crore, while Q4 FY26 saw EV Business growth of 31.35%, PAT growth of 13.60%, and EBITDA expansion of 24.78% year-on-year. The board recommended a dividend of ₹0.85 per share for FY26.

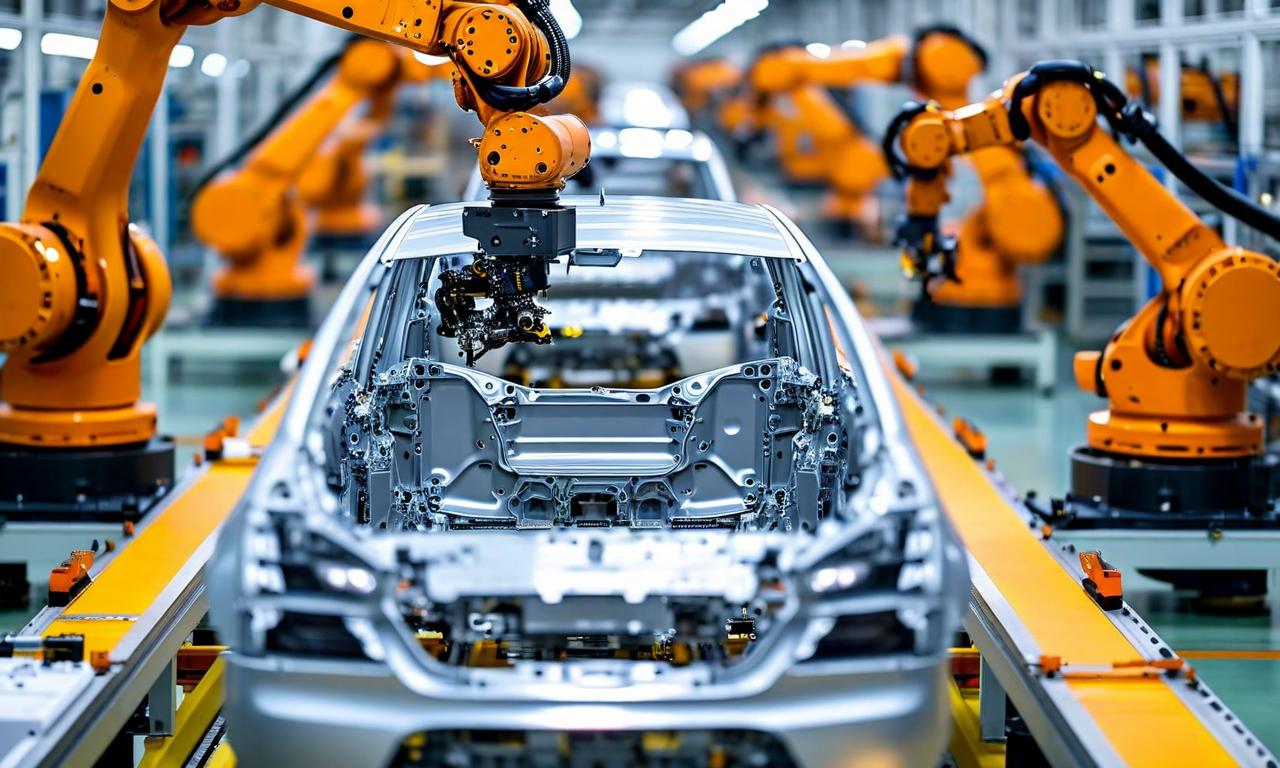
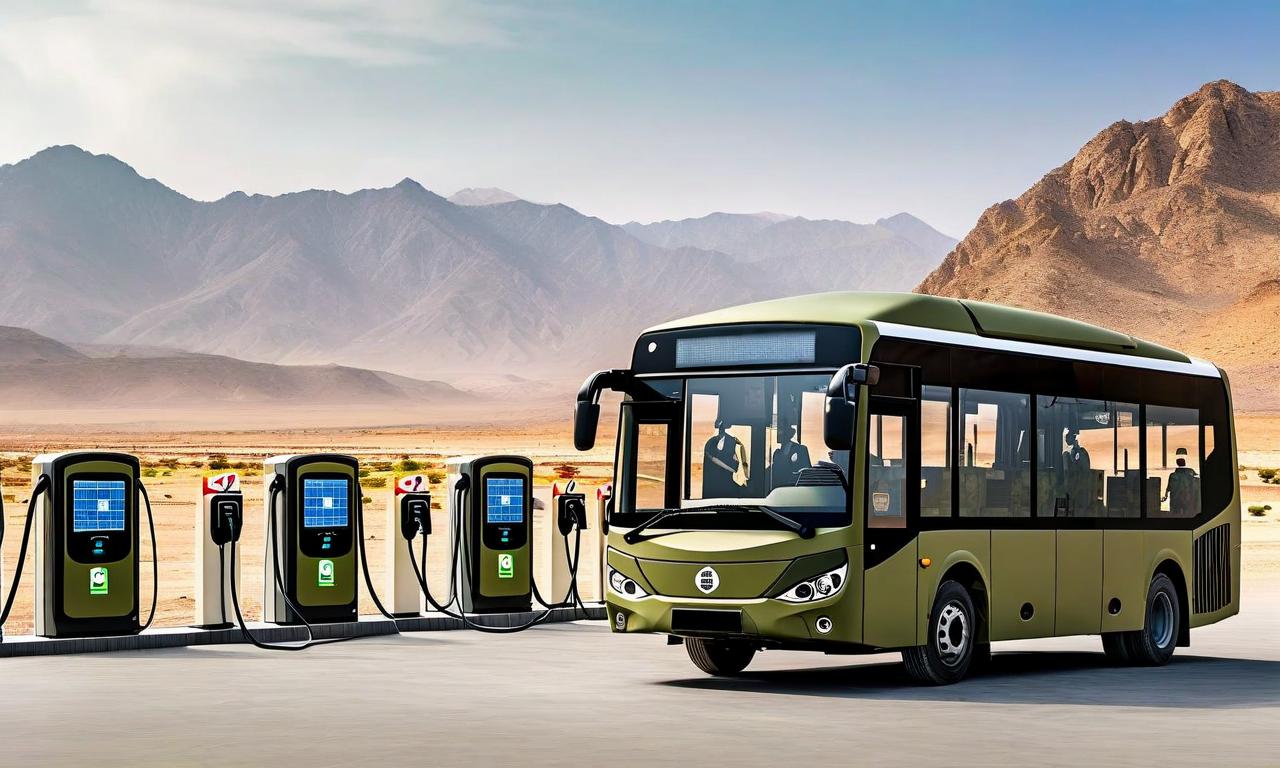
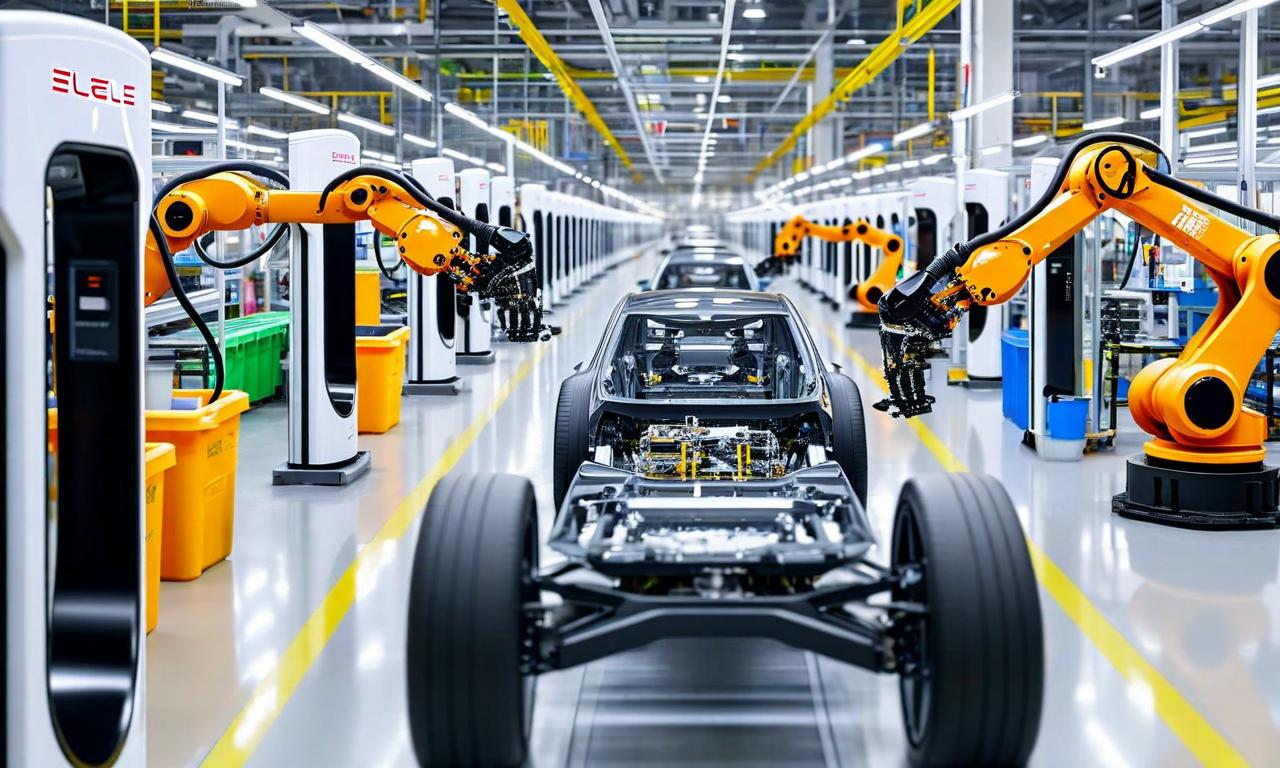
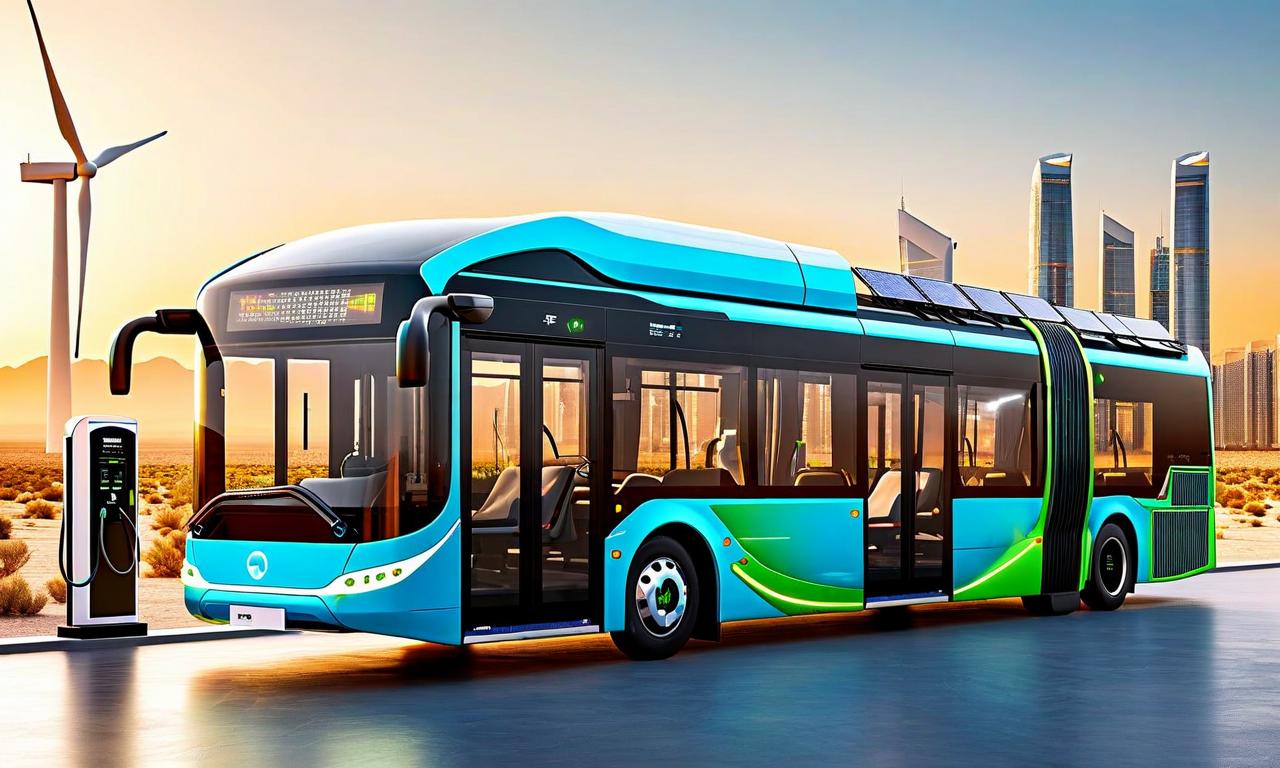
*this image is generated using AI for illustrative purposes only.
JBM Auto Limited published its audited financial results for the fourth quarter and full year ended March 31, 2026 in leading newspapers on May 12, 2026, following board approval on May 11, 2026. The results were advertised in Punjab Kesari (Hindi) Delhi Edition and Economic Times (English) Mumbai and Delhi Editions, pursuant to Regulation 47 read with Regulation 33 of the SEBI (Listing Obligations and Disclosure Requirements) Regulations, 2015. The company's Q4 performance highlighted robust growth across key metrics, with EV Business growing 31.35%, PAT rising 13.60%, EPS improving 11.74%, and EBITDA expanding 24.78% year-on-year.
Consolidated Financial Performance
JBM Auto's consolidated results for the quarter and year ended March 31, 2026 reflect steady growth across revenue and profitability metrics. The following table presents the key consolidated financial figures:
| Particulars: | Q4 FY26 (₹ Cr) | FY26 Full Year (₹ Cr) | Q4 FY25 (₹ Cr) |
|---|---|---|---|
| Total Income from Operations: | 1,882.47 | 6,227.30 | 1,692.32 |
| Net Profit before tax (before Exceptional Items & JV Share): | 115.12 | 351.72 | 102.46 |
| Net Profit before tax (after Exceptional Items & JV Share): | 107.89 | 310.28 | 90.49 |
| Net Profit after tax: | 83.82 | 238.01 | 72.03 |
| Total Comprehensive Income (attributable to owners): | 74.98 | 218.50 | 66.00 |
| Equity Share Capital: | 23.65 | 23.65 | 23.65 |
| Basic EPS (₹): | 3.14 | 9.25 | 2.81 |
| Diluted EPS (₹): | 3.14 | 9.25 | 2.81 |
All figures in ₹ crore unless otherwise stated. EPS is per share of ₹1 each.
Standalone Financial Performance
On a standalone basis, JBM Auto also reported healthy growth in revenue and profitability for the quarter and full year ended March 31, 2026, as detailed below:
| Particulars: | Q4 FY26 (₹ Cr) | FY26 Full Year (₹ Cr) | Q4 FY25 (₹ Cr) |
|---|---|---|---|
| Total Income from Operations: | 1,696.61 | 5,467.53 | 1,382.01 |
| Net Profit before tax (before Exceptional/Extraordinary Items): | 45.68 | 203.97 | 54.29 |
| Net Profit after tax (after Exceptional/Extraordinary Items): | 31.35 | 148.08 | 39.29 |
All figures in ₹ crore unless otherwise stated.
Key Q4 Growth Metrics
The company's Q4 FY26 performance demonstrated strong momentum across business segments. The headline growth indicators for the quarter are summarised below:
| Metric: | Q4 FY26 Growth |
|---|---|
| EV Business Growth: | +31.35% |
| PAT: | +13.60% |
| EPS: | +11.74% |
| EBITDA: | +24.78% |
Dividend and Board Decisions
The Board of Directors, at its meeting held on May 11, 2026, recommended a dividend of 85%, i.e., ₹0.85 per share (on fully paid-up equity shares of ₹1 each) for the year ended March 31, 2026, subject to the approval of members at the next Annual General Meeting. The audited financial results were reviewed by the Audit Committee and taken on record by the Board of Directors at the same meeting. The Statutory Auditors have expressed an unmodified opinion on the results.
The full format of the quarterly and year-ended financial results is available on the websites of BSE and NSE at www.bseindia.com and www.nseindia.com respectively, as well as on the company's website at www.jbmgroup.com . The newspaper advertisement was submitted to the stock exchanges by Company Secretary & Compliance Officer Sanjeev Kumar, and the results were signed off by Vice Chairman and Managing Director Nishant Arya.
Source: None/Company/INE927D01051/47f5f6346fab4677.pdf
Historical Stock Returns for JBM Auto
| 1 Day | 5 Days | 1 Month | 6 Months | 1 Year | 5 Years |
|---|---|---|---|---|---|
| -2.01% | -3.24% | -9.48% | +19.41% | +3.94% | +556.74% |
How might JBM Auto's 31.35% EV business growth trajectory position it against competitors like Olectra and Switch Mobility in securing future government and state transport corporation bus contracts?
Given the gap between standalone and consolidated PAT margins, what is the outlook for JBM Auto's joint venture entities and could they become a drag or catalyst for consolidated profitability in FY27?
With EBITDA growing at 24.78% but PAT growing at a slower 13.60%, what capital expenditure or interest cost pressures could impact JBM Auto's bottom-line expansion in the coming fiscal year?
 15
15