

Indus Towers Q4FY26 Results: Revenue ₹8,101 Cr Up 4.8%, ₹14 Dividend Announced


Indus Towers announced Q4FY26 results showing revenue growth of 4.8% to ₹8,101 crores with profit after tax of ₹1,793 crores. The Board recommended a final dividend of ₹14 per share subject to AGM approval. The company operates 264,514 towers with strategic expansion into African markets through new subsidiaries.



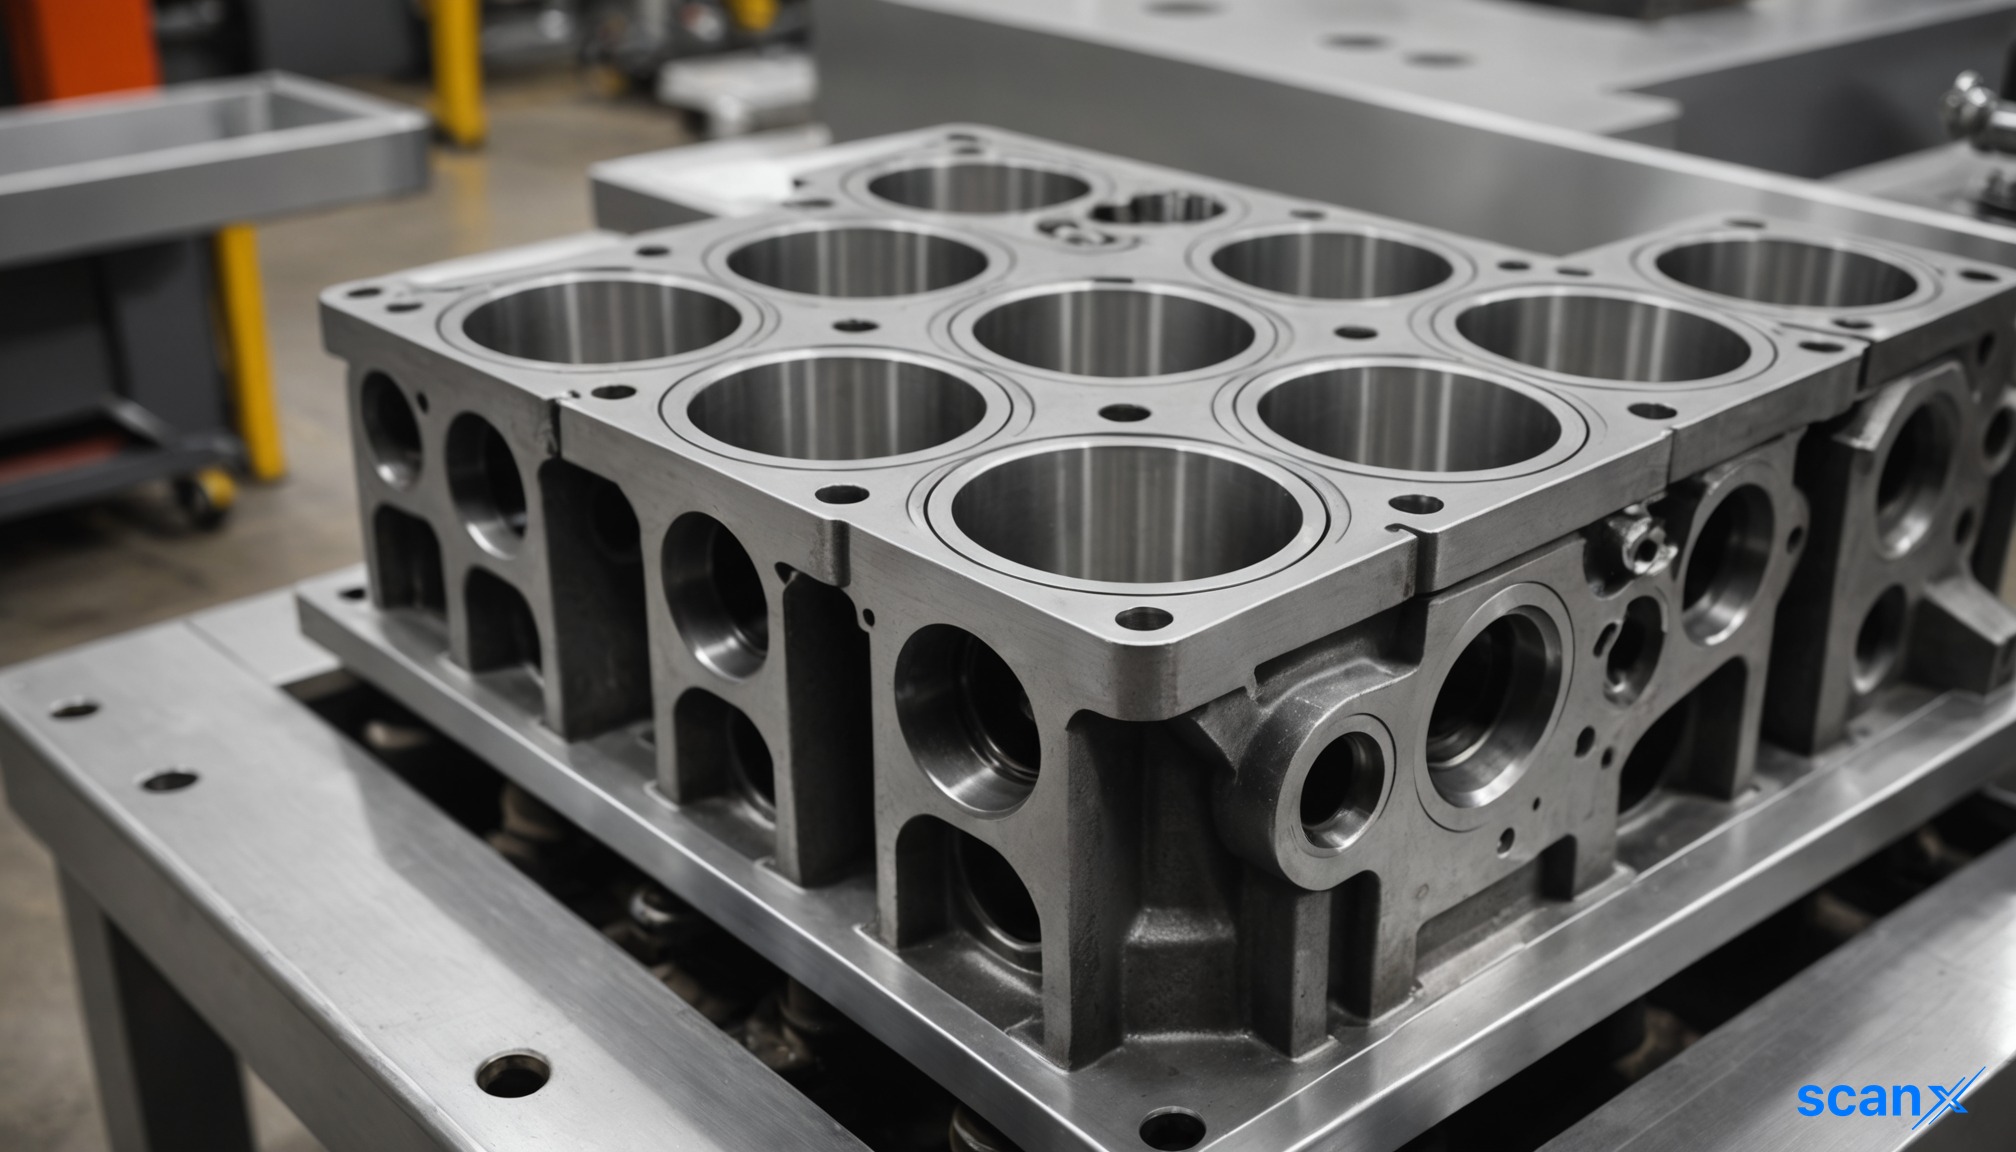
*this image is generated using AI for illustrative purposes only.
Indus Towers announced its audited consolidated financial results for Q4FY26 and full year ended March 31, 2026, through regulatory filings submitted to BSE Limited and National Stock Exchange of India Limited on April 30, 2026. The telecommunications infrastructure company filed the announcement under Regulation 30 and 33 of SEBI (Listing Obligations and Disclosure Requirements) Regulations, 2015.
Q4FY26 Financial Performance
The company delivered steady quarterly performance with consolidated revenue reaching ₹8,101 crores, representing a 4.8% year-on-year growth. EBITDA stood at ₹4,464 crores, up 1.6% YoY, with an EBITDA margin of 55.1%. Profit after tax increased to ₹1,793 crores, marking a 0.8% YoY growth.
| Financial Metric: | Q4FY26 | Q4FY25 | YoY Growth |
|---|---|---|---|
| Revenue: | ₹8,101 Cr | ₹7,727 Cr | 4.8% |
| EBITDA: | ₹4,464 Cr | ₹4,395 Cr | 1.6% |
| EBIT: | ₹2,586 Cr | ₹2,631 Cr | -1.7% |
| Profit After Tax: | ₹1,793 Cr | ₹1,779 Cr | 0.8% |
| EBITDA Margin: | 55.1% | 56.9% | -1.8pp |
Full Year FY26 Results
For the complete financial year, Indus Towers reported consolidated revenues of ₹32,493 crores, up 7.9% YoY. However, consolidated EBITDA declined to ₹17,976 crores, down 13.8% YoY, while consolidated profit after tax decreased to ₹7,145 crores, down 28.1% YoY.
| Annual Metric: | FY26 | FY25 | YoY Change |
|---|---|---|---|
| Revenue: | ₹32,493 Cr | ₹30,117 Cr | 7.9% |
| EBITDA: | ₹17,976 Cr | ₹20,856 Cr | -13.8% |
| Profit After Tax: | ₹7,145 Cr | ₹9,937 Cr | -28.1% |
Operational Metrics and Infrastructure
As of March 31, 2026, Indus Towers maintained its position as a leading telecommunications infrastructure provider with a robust operational base. The company operated 264,514 towers with 428,014 co-locations, maintaining a sharing factor of 1.62.
| Parameter: | Mar 31, 2026 | Dec 31, 2025 | Q-on-Q Growth | Mar 31, 2025 | Y-on-Y Growth |
|---|---|---|---|---|---|
| Towers: | 264,514 | 259,622 | 4,892 | 249,305 | 15,209 |
| Co-locations: | 428,014 | 421,822 | 6,192 | 405,435 | 22,579 |
| Sharing Factor: | 1.62 | 1.62 | Stable | 1.64 | - |
| Lean Co-locations: | 14,044 | 13,989 | 55 | 13,878 | 166 |
Board Meeting and Dividend Announcement
The Board of Directors formally recommended a final dividend of ₹14 per equity share of face value ₹10 each for the financial year ended March 31, 2026, subject to shareholder approval at the ensuing Annual General Meeting. The dividend, if approved, shall be paid within 30 days from the date of shareholders' approval. The Board meeting was conducted on April 30, 2026, commencing at 03:05 p.m. (IST) and concluding at 07:25 p.m. (IST).
| Dividend Details: | Specifications |
|---|---|
| Final Dividend: | ₹14 per equity share |
| Face Value: | ₹10 per share |
| Subject to: | AGM approval |
| Payment Timeline: | Within 30 days of approval |
| Total Dividend Amount: | ₹36,934 Million |
Strategic Expansion and Corporate Developments
The company continues its strategic expansion into African markets, with subsidiaries incorporated in Nigeria, Uganda, and Zambia. During FY26, the company infused equity of AED 300,000 and provided a shareholder loan of USD 2.1 million to its UAE subsidiary. Additionally, on April 28, 2026, the company incorporated Indus Towers Global Ventures IFSC Limited in GIFT City, Gujarat, to serve as an investment holding company for overseas subsidiaries.
Market Position
Indus Towers continues to operate as one of the largest tower infrastructure providers globally, with presence across all 22 telecommunications circles in India. The company's portfolio of 264,514 telecom towers reinforces its market leadership position, supported by comprehensive deployment capabilities and well-developed operational processes.
Historical Stock Returns for Indus Towers
| 1 Day | 5 Days | 1 Month | 6 Months | 1 Year | 5 Years |
|---|---|---|---|---|---|
| +1.27% | -0.90% | -1.65% | -12.97% | +12.72% | +24.71% |

How will Indus Towers' expansion into African markets (Nigeria, Uganda, Zambia) impact its revenue diversification and overall growth trajectory in FY27?
What factors contributed to the 28.1% decline in annual profit despite 7.9% revenue growth, and are these headwinds expected to persist?
Will the company's aggressive tower addition strategy (15,209 new towers in FY26) continue at the same pace given the margin compression challenges?
 16
16














 Access Market Heat-map & Insights
  Create, Save & Share your Screener
  Use 200+ Screening Filters





