

Huhtamaki India net profit surges 75% in Q2CY26 on sales growth


Huhtamaki India delivered strong Q2CY26 results with net profit surging 75.3% to ₹437.3 crore and sales rising 23.1% to ₹7,286 million. EBITDA margins expanded to 10.5%, aided by pricing and volume growth. The company maintains nil net debt and robust liquidity.


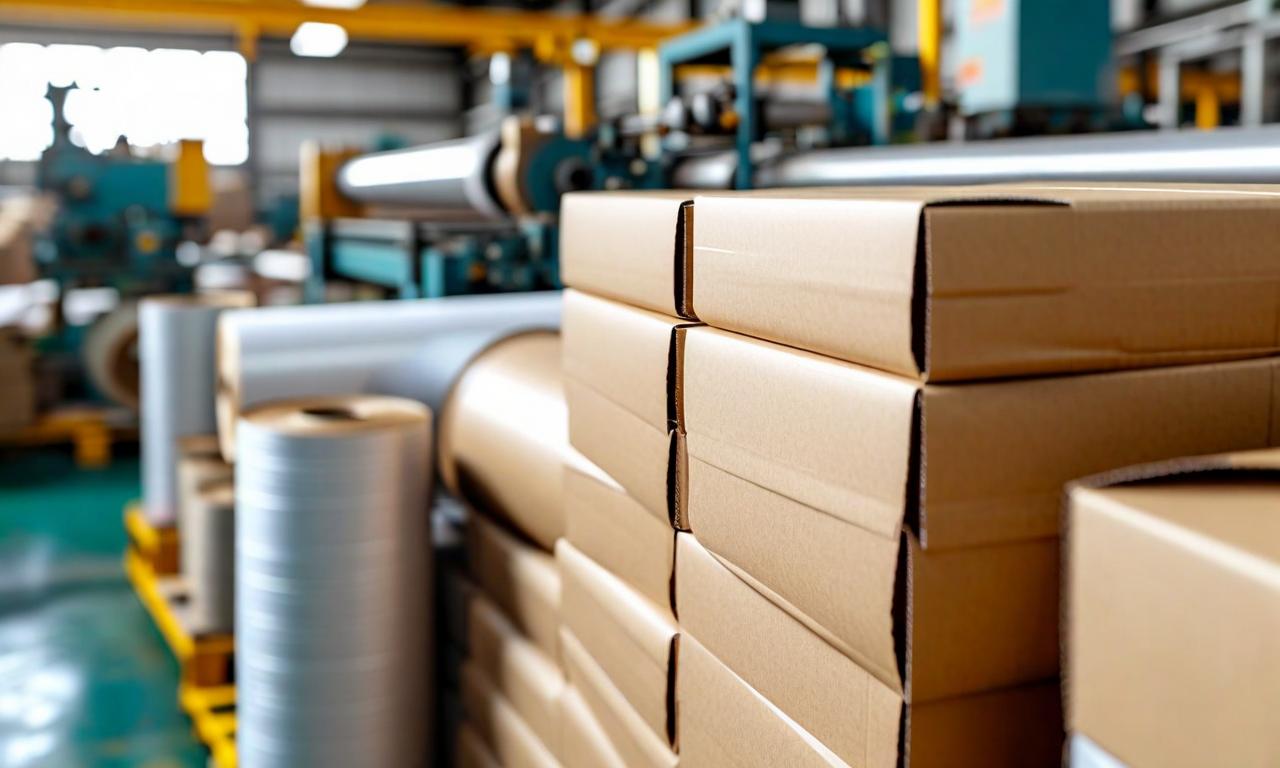
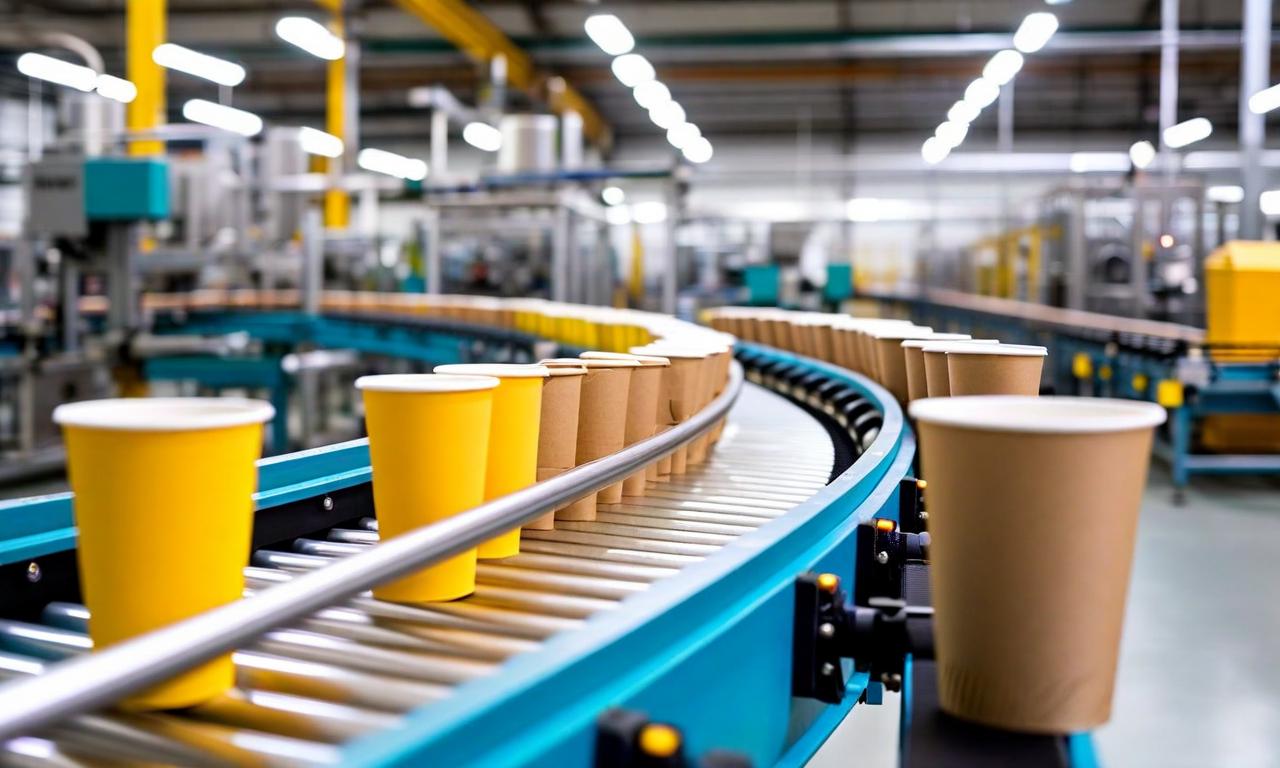
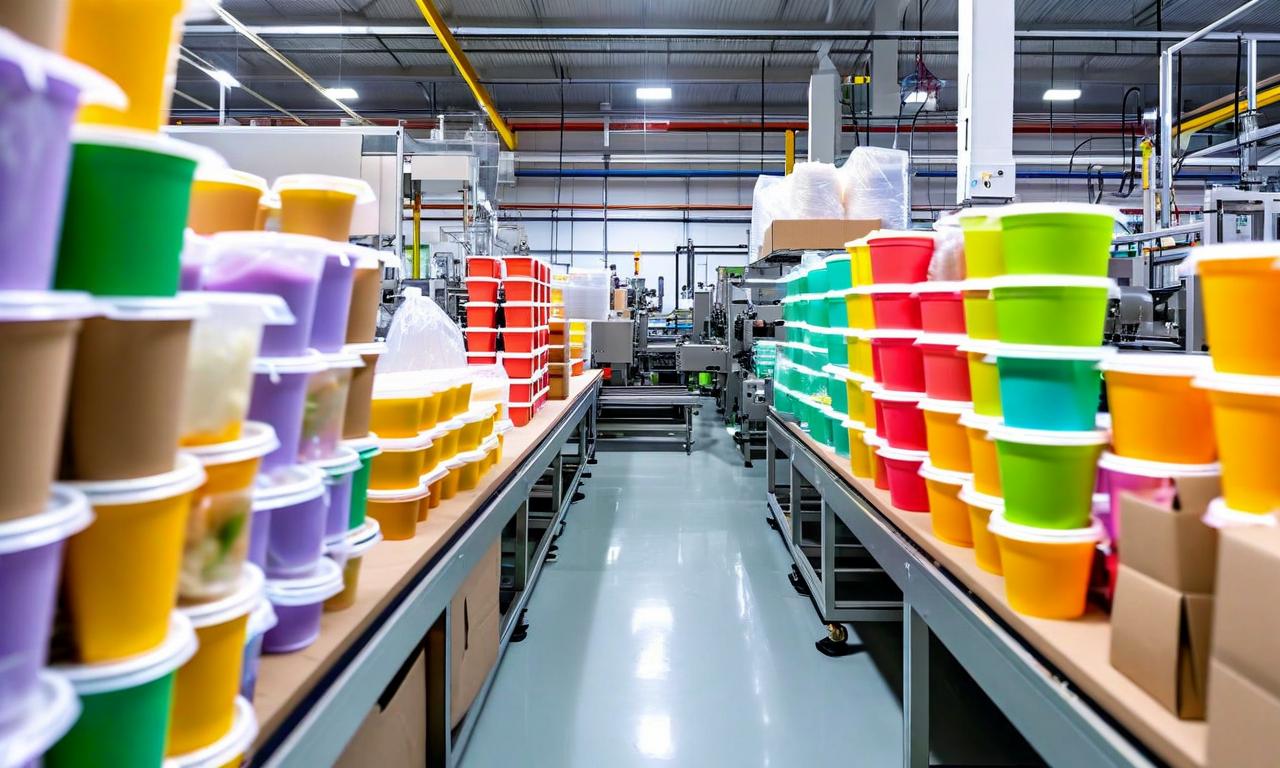
*this image is generated using AI for illustrative purposes only.
Huhtamaki India Limited reported a robust financial performance for the second quarter of calendar year 2026 (Q2CY26), ending June 30, 2026, with net profit soaring 75.3% year-on-year to ₹437.3 crore. The growth was primarily driven by a 23.1% increase in net sales to ₹7,286.0 million, supported by a healthy mix of volume growth and pricing power that offset commodity cost pressures from the Middle East crisis. This strong operational execution resulted in expanded margins, positioning the company favorably in the flexible packaging sector.
The earnings conference call, held on July 27, 2026, at 3:30 PM IST, provided further insights into these results. Managing Director Kamal Taneja and Chief Financial Officer Amit Gupta highlighted that EBITDA rose 55.1% to ₹764.4 million, while EBIT jumped 71.8% to ₹621.6 million. These improvements reflect operational efficiencies and volume gains, although they were partially impacted by a one-time impairment charge. The disclosure was made in compliance with Regulation 30 of the SEBI (Listing Obligations and Disclosure Requirements) Regulations, 2015.
Financial Performance Highlights
For the first half of 2026 (H1CY26), Huhtamaki India demonstrated consistent momentum. Net sales for the period reached ₹13,222.3 million, an 11.6% increase over H1CY25. Profit before tax (PBT) excluding exceptional items grew by 77.5% to ₹587.9 million in Q2CY26 alone. The company’s earnings per share (EPS), excluding exceptional items, stood at ₹5.79, up from ₹3.27 in the corresponding quarter last year.
| Metric | Q2CY26 (₹ Mn) | Q2CY25 (₹ Mn) | YoY Change |
|---|---|---|---|
| Net Sales | 7,286.0 | 5,919.4 | +23.1% |
| EBITDA | 764.4 | 492.7 | +55.1% |
| EBITDA Margin | 10.5% | 8.3% | +220 bps |
| EBIT | 621.6 | 361.8 | +71.8% |
| Net Profit | 437.3 | 249.4 | +75.3% |
Balance Sheet and Cash Flow Strength
Huhtamaki India maintains a pristine balance sheet with nil net debt. As of June 2026, the company held cash and cash equivalents of ₹2,706 million, along with ₹1,253 million invested in liquid mutual funds. Unutilized fund-based limits with banks stood at ₹4,272 million, providing ample liquidity headroom. The debt-to-equity ratio remained stable at 0.1, reflecting disciplined capital allocation.
Operating working capital increased to ₹4,643 million from ₹3,051 million in December 2025, mainly due to higher inventory levels and trade receivables. Despite this, operating cash generation remained strong, supported by higher profit before tax. Net investing activities generated a cash inflow of ₹1,853 million in H1CY26, indicating lower investment deployment compared to the previous year.
What the Numbers Show
The divergence between revenue growth (+23.1%) and EBITDA margin expansion (from 8.3% to 10.5%) indicates significant operating leverage. While commodity inflation posed challenges, the company’s ability to pass on costs through pricing, combined with volume growth, drove profitability higher than top-line growth. The nil net debt position allows Huhtamaki India to pursue strategic opportunities without financial strain, reinforcing its resilience against macroeconomic uncertainties.
Sustainability Initiatives
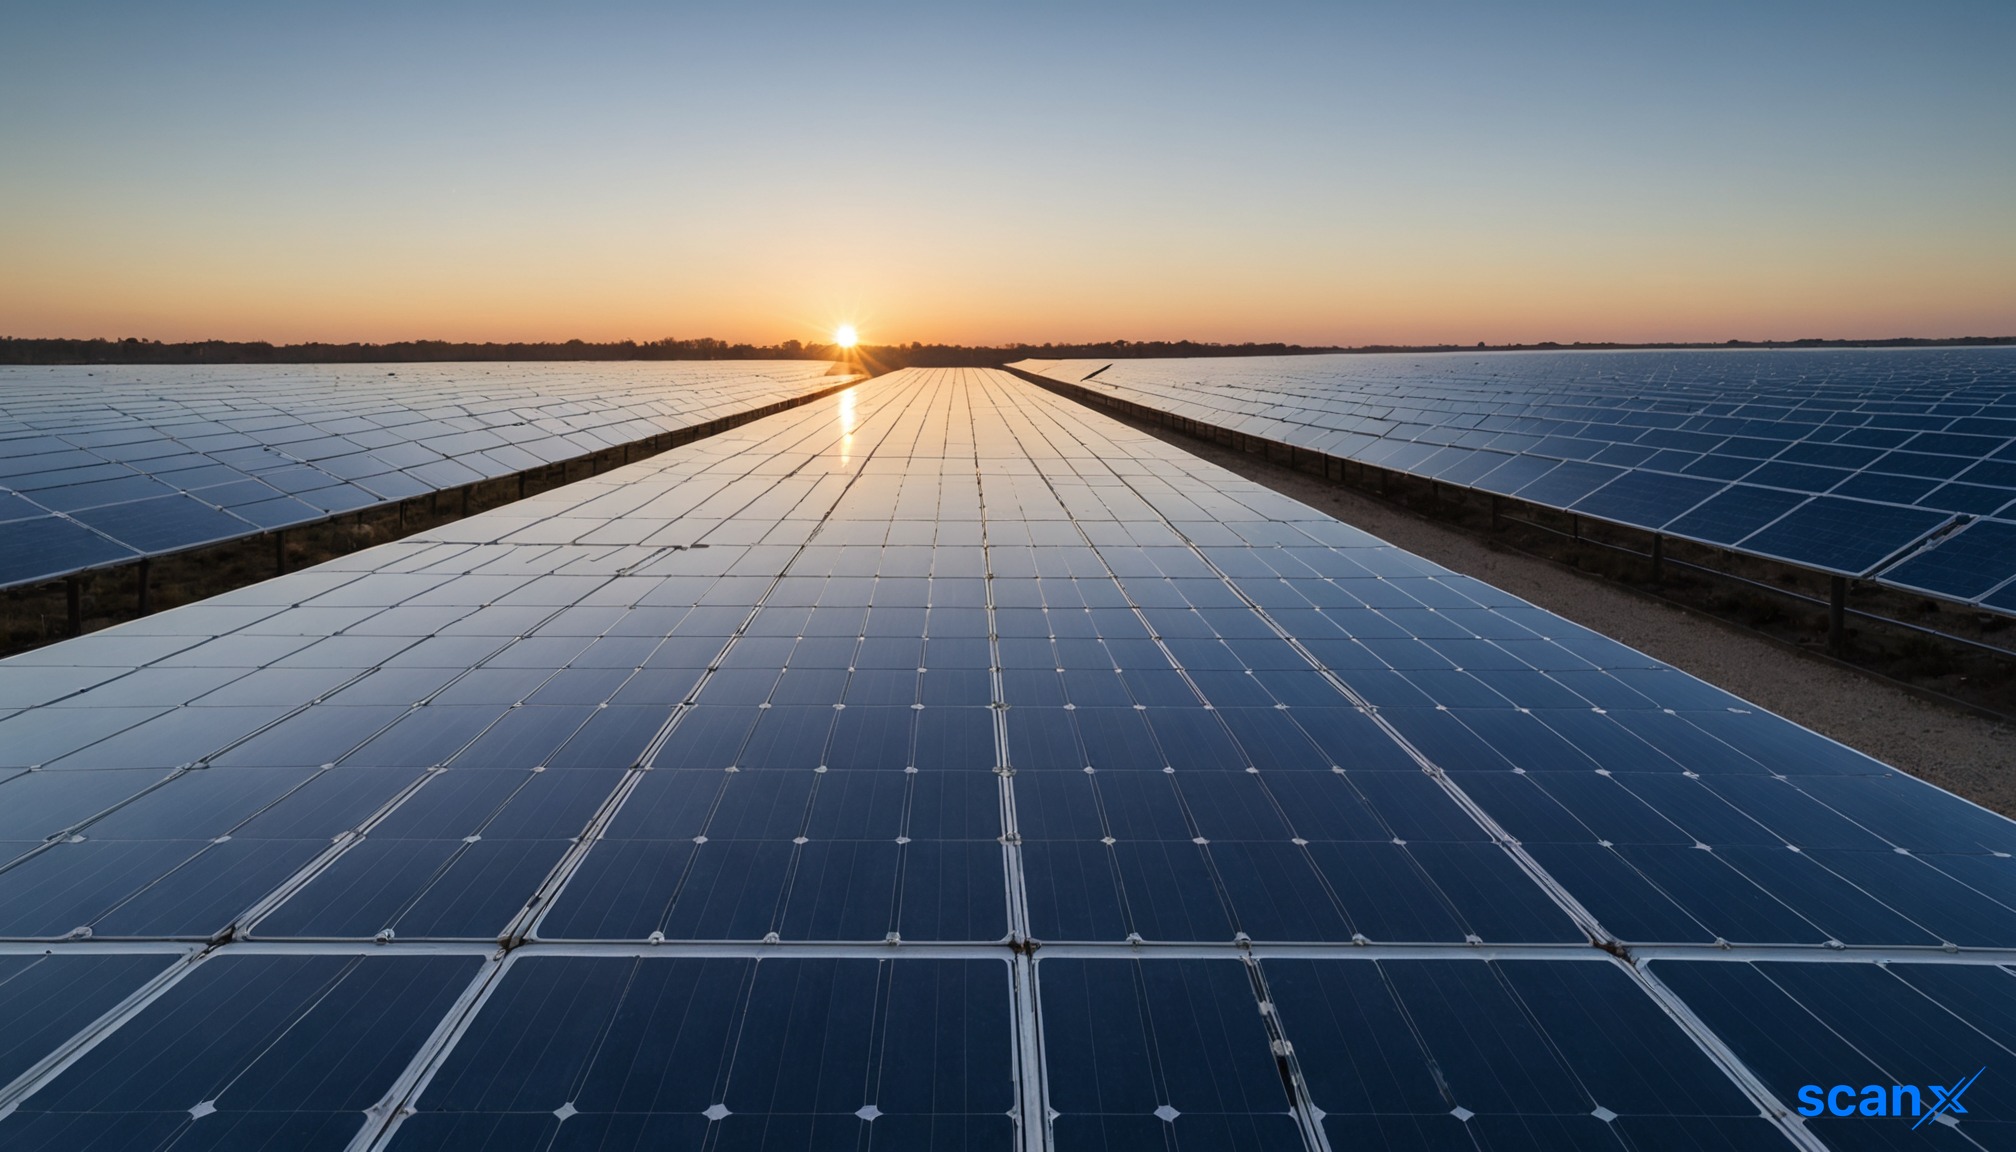
Beyond financial metrics, Huhtamaki India emphasized its sustainability commitments. The company reported a 40% reduction in the 12-month rolling year-to-date Total Recordable Incident Rate (TRIR). Solar captive generation at the Khopoli plant is expected in Q3CY26, enhancing renewable energy usage. Multiple plants, including Khopoli, Rudrapur, and Silvassa, continue to maintain Zero Liquid Discharge (ZLD) status, underscoring the firm’s focus on water conservation and environmental stewardship.
Historical Stock Returns for Huhtamaki PPL
| 1 Day | 5 Days | 1 Month | 6 Months | 1 Year | 5 Years |
|---|---|---|---|---|---|
| -0.19% | -3.21% | -10.15% | +28.33% | -3.89% | -15.48% |

How might the ongoing Middle East crisis impact future commodity pricing and Huhtamaki's ability to sustain its current pricing power in Q3CY26?
Given the nil net debt position and strong cash reserves, what specific strategic acquisitions or capacity expansion projects is Huhtamaki India likely to prioritize in the next fiscal year?
Will the implementation of solar captive generation at the Khopoli plant in Q3CY26 significantly reduce operational costs, and how will this impact long-term EBITDA margins?
 17
17










 Access Market Heat-map & Insights
  Create, Save & Share your Screener
  Use 200+ Screening Filters





