

Happy Forgings Q1FY27 PAT surges 39% to ₹91 crore on volume growth


Happy Forgings delivered strong Q1FY27 results with ₹91 crore PAT and ₹449 crore revenue, driven by volume growth and margin expansion. The company highlighted successful price negotiations with OEMs, capacity additions, and a robust order book of ₹950 crore supporting future growth.

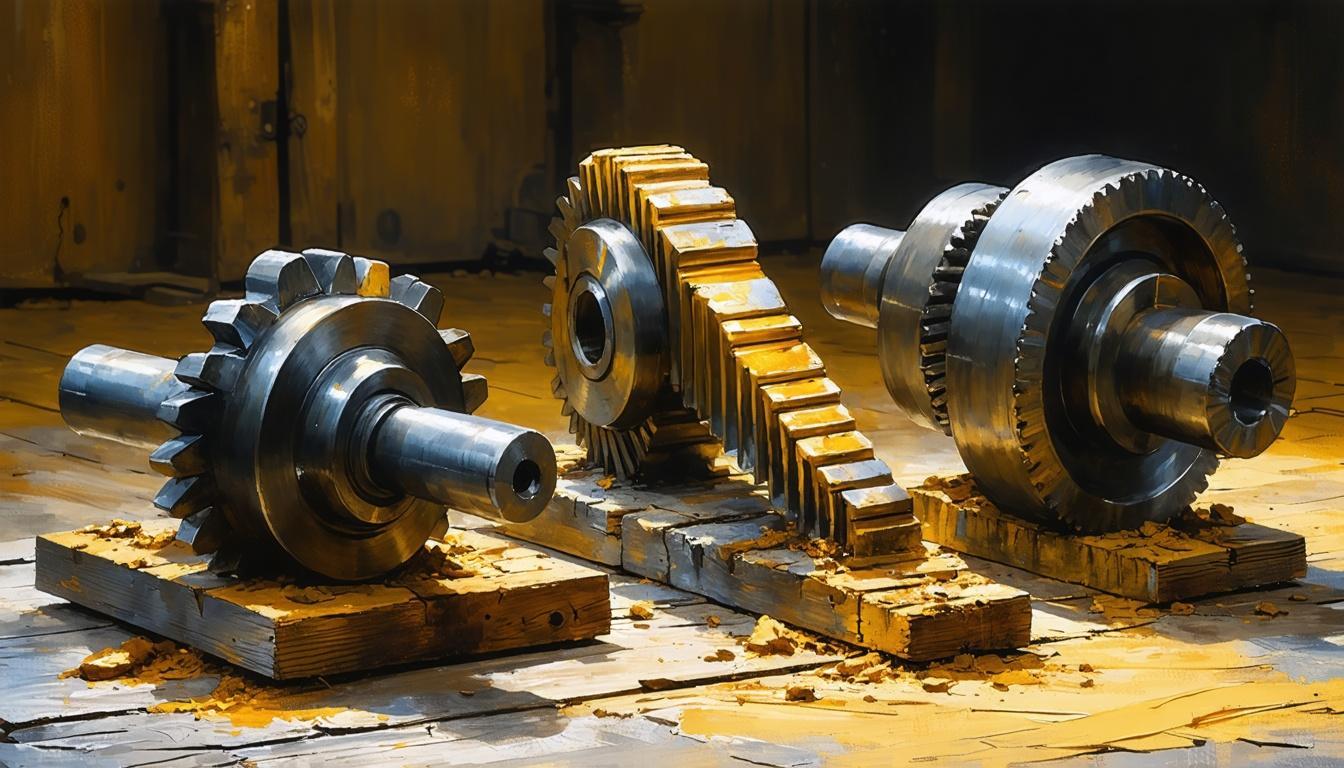

*this image is generated using AI for illustrative purposes only.
Happy Forgings Limited delivered record consolidated financial results for the quarter ended June 30, 2026, with net profit after tax (PAT) surging 39.2% year-on-year to ₹91 crore. Revenue from operations rose 27.0% YoY to ₹449 crore, marking a sequential increase of 6.0%. The strong performance was driven by a 23.1% growth in finished goods sales volume to 17,793 MT and a 3.2% improvement in average realisations to ₹253/kg. This operational efficiency translated into robust profitability, reinforcing the company’s position as a leading manufacturer of heavy forgings and precision machined components.
The financial results were published in "Financial Express" (English) and "Jag bani" (Punjabi) on August 5, 2026, pursuant to Regulation 30 and Regulation 47 of the SEBI (Listing Obligations and Disclosure Requirements) Regulations, 2015. Bindu Garg, Company Secretary & Compliance Officer of Happy Forgings Limited, signed off on the investor presentation and the newspaper publication notice. Management attributed the growth to broad-based demand across commercial vehicle (CV), passenger vehicle (PV), farm equipment, and off-highway segments, with exports contributing significantly to the top-line expansion.
Financial Performance Highlights
The quarter saw significant margin expansion, with EBITDA margin remaining above 30% for the fourth consecutive quarter and PAT margin exceeding 20% for the first time. Below is a summary of key financial metrics for Q1FY27:
| Metric | Q1FY27 | Q1FY26 | YoY Change |
|---|---|---|---|
| Revenue (₹ Crs) | 449 | 354 | +27.0% |
| Finished Goods Volume (MT) | 17,793 | 14,457 | +23.1% |
| Realisation/Kg (₹) | 253 | 245 | +3.2% |
| Gross Profit Margin (%) | 60.7% | 57.9% | +276 bps |
| EBITDA Margin (%) | 31.3% | 28.6% | +275 bps |
| PAT Margin (%) | 20.4% | 18.6% | +178 bps |
Ashish Garg, Managing Director, Happy Forgings Limited, stated that domestic revenues grew approximately 25% YoY, while export revenues increased by over 30% YoY. Exports now contribute 28% of total revenue, indicating successful diversification. The passenger vehicle and industrial segments also gained share, rising to 8% and 16% of revenue respectively, while commercial vehicles contributed 33%.
What the Numbers Show
The data reveals a clear decoupling of revenue growth from cost inflation, evidenced by the expansion in both gross and operating margins. While finished goods volume grew by 23.1%, EBITDA grew by 39.3%, suggesting significant operating leverage. The improvement in realisation per kilogram alongside stable raw material costs has allowed the company to capture higher value addition per unit. Furthermore, the PAT margin crossing the 20% threshold for the first time indicates that top-line growth is translating efficiently into bottom-line gains, supported by disciplined expense management and an optimized product mix towards high-margin machined components, which now account for 90% of revenues.
Capacity and Future Outlook
Happy Forgings continues to invest in capacity expansion, with planned additions of ~35,000 MT in forging and ~20,000 MT in machining expected to be operational by FY28. The installation of equipment for ultra-heavy component manufacturing facilities is on track for completion by the end of FY27, positioning the company to commence commercial revenues from FY28. Additionally, a captive solar power project is progressing well, expected to contribute to operating cost efficiencies from FY28 onwards. The incremental order book, largely led by exports and passenger vehicles, provides visibility for additional annual revenue ramping up to approximately ₹950 crore over the next two to three years.
Historical Stock Returns for Happy Forgings
| 1 Day | 5 Days | 1 Month | 6 Months | 1 Year | 5 Years |
|---|---|---|---|---|---|
| -0.94% | -4.05% | -13.80% | +50.19% | +103.48% | +86.52% |

How might the upcoming commissioning of the ultra-heavy component manufacturing facility in FY28 alter Happy Forgings' competitive positioning against global peers in the heavy engineering sector?
What are the potential risks to maintaining the 30%+ EBITDA margin if raw material costs for steel and alloys experience significant inflation in FY27?
With exports now contributing 28% of revenue, how vulnerable is the company's growth trajectory to potential trade tariffs or geopolitical shifts in its key international markets?
 19
19








 Create Custom Screeners
  Access 200+ Pre-built Filters
  Use 50+ Readymade Screener





