

Happy Forgings net profit surges 39% in Q1FY26 on revenue growth


Happy Forgings' Q1FY26 standalone net profit surged 39% to ₹914.6 crore, supported by a 27% revenue jump to ₹4,494.2 crore. EBITDA margin expanded to 31.3%, reflecting strong operational leverage.


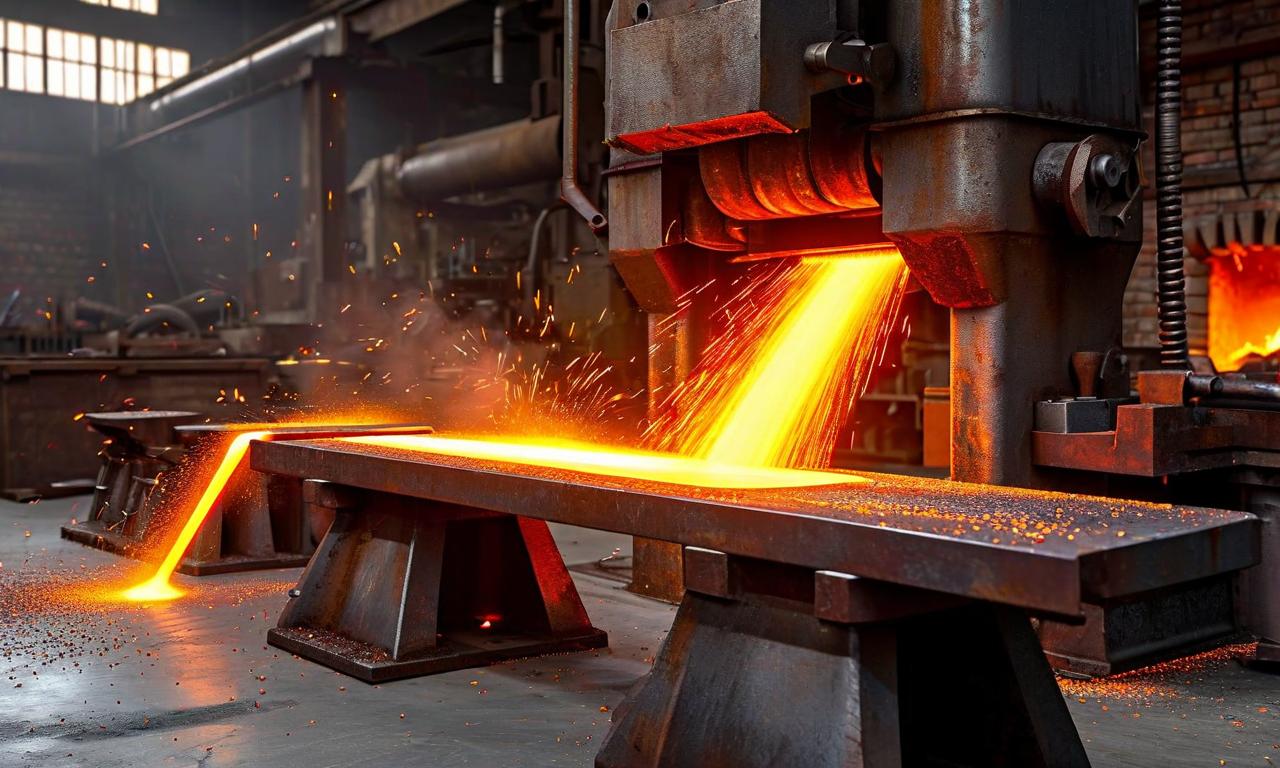
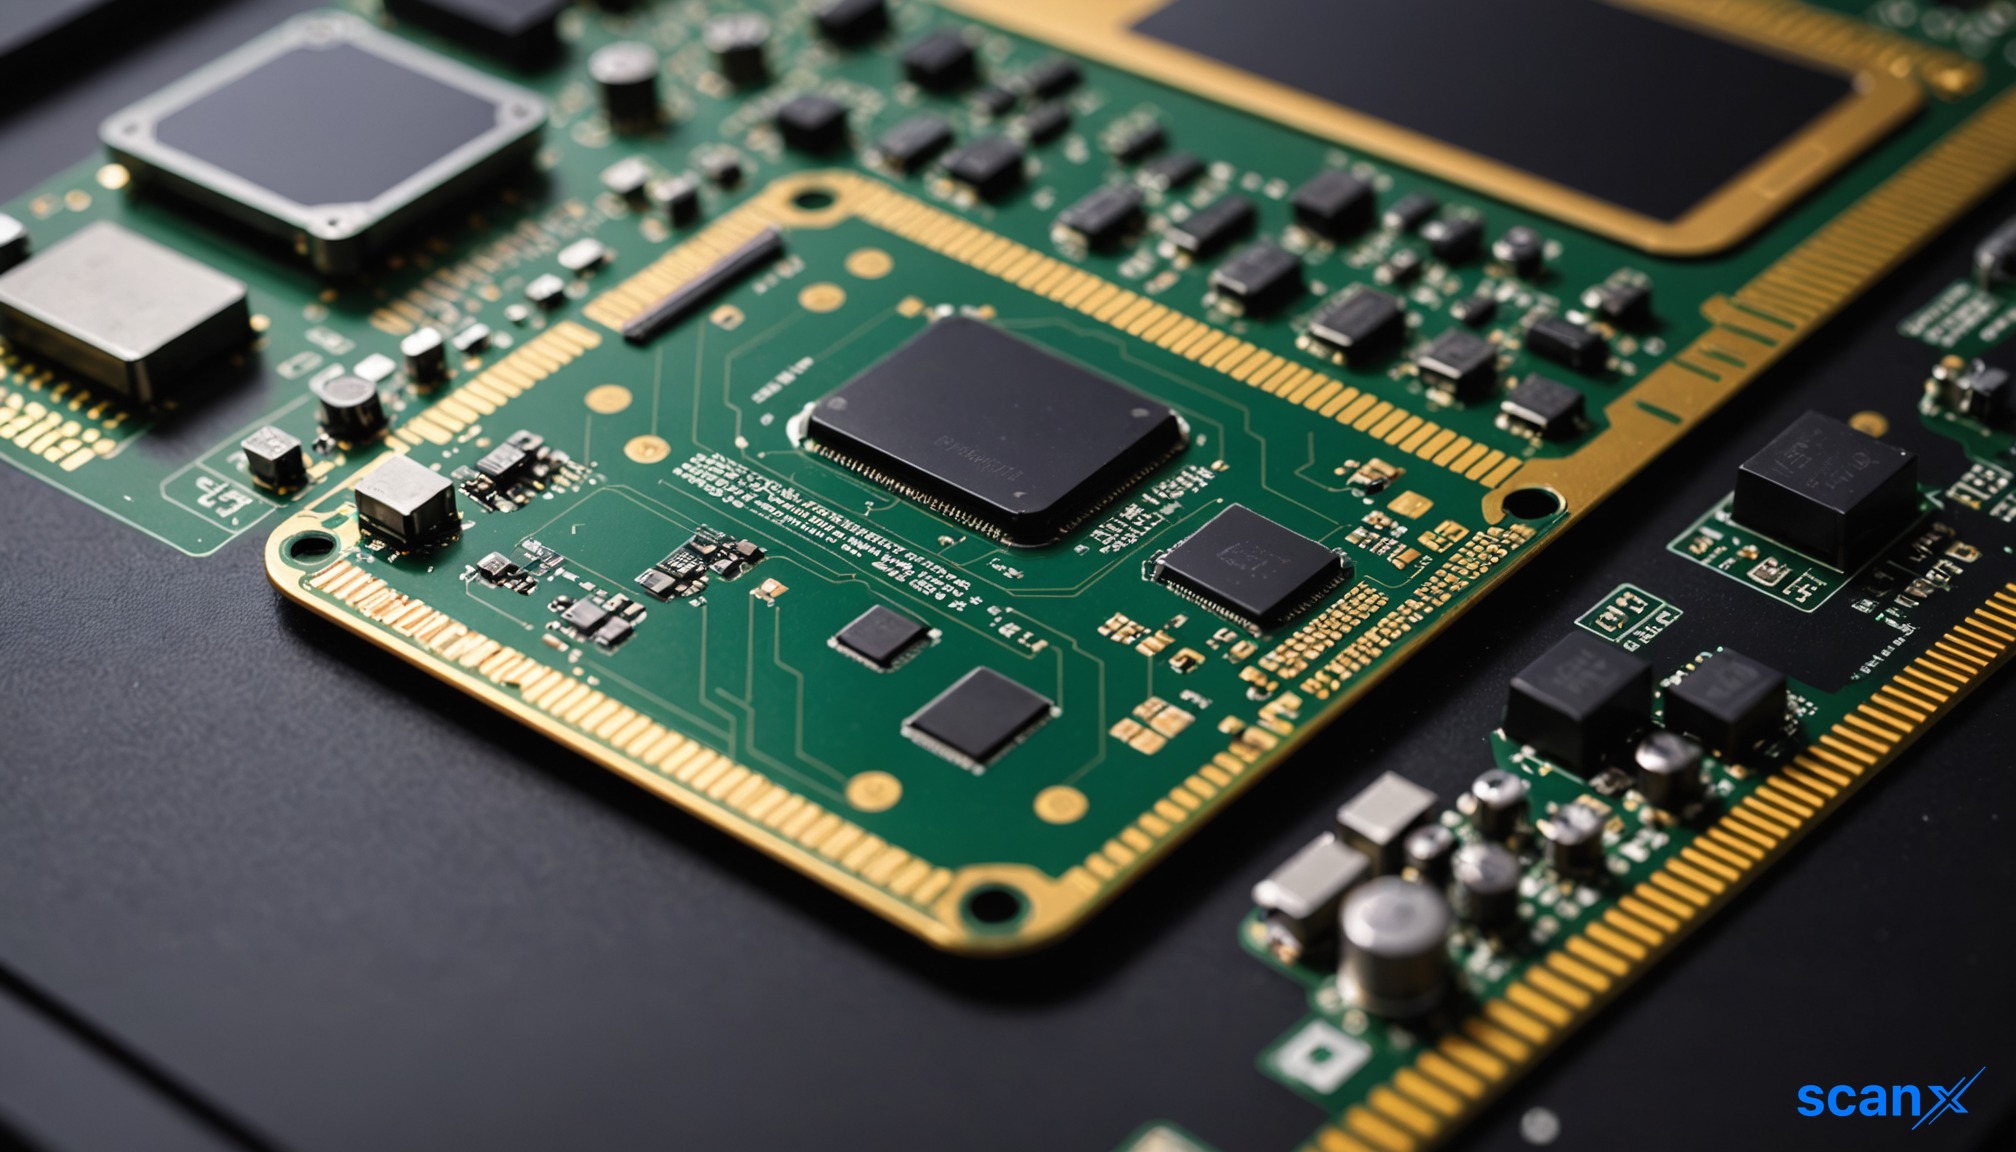
*this image is generated using AI for illustrative purposes only.
Happy Forgings reported a significant improvement in its financial performance for the first quarter of FY26 (Q1FY26), with standalone net profit rising 39% year-on-year to ₹914.6 crore. The earnings beat was underpinned by a robust 27% increase in revenue from operations, which climbed to ₹4,494.2 crore from ₹3,538.0 crore in the corresponding period of the previous year. This strong top-line growth, combined with disciplined cost management, allowed the company to expand its EBITDA margin to 31.3% from 28.59%, signaling enhanced operational leverage and efficiency.
The Board of Directors, meeting on August 04, 2026, approved the unaudited standalone and consolidated financial results for the quarter ended June 30, 2026. The results were reviewed by the statutory auditor, S.R. Batliboi & Co. LLP, pursuant to Regulation 33 of the SEBI (Listing Obligations and Disclosure Requirements) Regulations, 2015. The company operates as a single segment entity manufacturing auto components and engineering parts, with no separate segment information disclosed.
Key Financial Highlights
The financial data reveals a broad-based improvement across key profitability metrics. Earnings before interest, taxes, depreciation, and amortisation (EBITDA) grew to approximately ₹1,407.2 crore compared to ₹1,010.0 crore in Q1FY25. The expansion in EBITDA margin underscores the company's ability to convert revenue into operating profit more effectively than in the prior year.
| Metric | Q1FY26 (Standalone) | Q1FY25 (Standalone) | YoY Change |
|---|---|---|---|
| Revenue from Operations | ₹4,494.2 crore | ₹3,538.0 crore | +27.0% |
| Net Profit | ₹914.6 crore | ₹656.9 crore | +39.2% |
| EBITDA Margin | 31.3% | 28.59% | +271 bps |
| Basic EPS | ₹9.70 | ₹6.97 | +39.2% |
Note: Figures are rounded for readability. Source: Company filing.
Profitability and Operational Efficiency
The simultaneous growth in absolute EBITDA and net profit highlights Happy Forgings' consistent improvement in bottom-line performance. The net profit increase from ₹656.9 crore to ₹914.6 crore reflects a meaningful uplift in earnings per share, which rose to ₹9.70 from ₹6.97 in the year-ago quarter. Diluted EPS followed a similar trajectory, increasing to ₹9.68 from ₹6.96.
Total income for the quarter stood at ₹4,605.1 crore, aided by other income of ₹110.8 crore, up from ₹103.5 crore in Q1FY25. Total expenses were contained at ₹3,378.7 crore, despite an increase in cost of raw materials and components consumed to ₹1,878.0 crore from ₹1,457.5 crore. Employee benefits expense rose to ₹387.0 crore from ₹320.9 crore, while finance costs decreased slightly to ₹30.6 crore from ₹23.0 crore, indicating favorable debt servicing conditions or lower interest rates.
Consolidated Results and Subsidiary Performance
The consolidated results mirrored the standalone figures closely, with consolidated net profit at ₹914.6 crore and revenue from operations at ₹4,494.2 crore. The group includes one wholly-owned subsidiary, HFL Technologies Private Limited, incorporated on March 16, 2024. For the quarter ended June 30, 2026, the subsidiary reported nil revenues and a net loss after tax of ₹0.21 lakh, contributing minimally to the group's overall financial position. The independent auditor's report on the subsidiary's interim results was relied upon for the consolidated conclusion.
What the Numbers Show
The divergence between revenue growth (27%) and net profit growth (39%) indicates a positive operating leverage effect. As fixed costs remain relatively stable while sales volume increases, each additional unit sold contributes more significantly to the bottom line. The expansion in EBITDA margin by over 270 basis points suggests that variable costs did not increase proportionally with revenue, potentially due to better input cost management or a shift towards higher-margin product mixes. This trend reinforces the company's financial momentum and operational resilience in the auto components sector.
Historical Stock Returns for Happy Forgings
| 1 Day | 5 Days | 1 Month | 6 Months | 1 Year | 5 Years |
|---|---|---|---|---|---|
| -0.94% | -4.05% | -13.80% | +50.19% | +103.48% | +86.52% |

Can Happy Forgings sustain its 31.3% EBITDA margin in Q2FY26 given potential volatility in raw material costs for auto components?
How will the integration of HFL Technologies Private Limited impact the group's revenue contribution in the upcoming fiscal year?
What specific operational efficiencies or product mix shifts drove the 270 basis point expansion in EBITDA margin compared to the prior year?
 18
18







 Access Market Heat-map & Insights
  Create, Save & Share your Screener
  Use 200+ Screening Filters





