

Godrej Properties Q1FY26 net profit falls 42% to ₹349.38 crore


Godrej Properties reported a 41.8% decline in consolidated net profit to ₹349.38 crore for Q1FY26, despite a 16.5% increase in revenue to ₹506.17 crore. The drop was driven by a 44.7% fall in real estate segment pre-tax profits, while standalone net profit rose marginally to ₹60.54 crore.


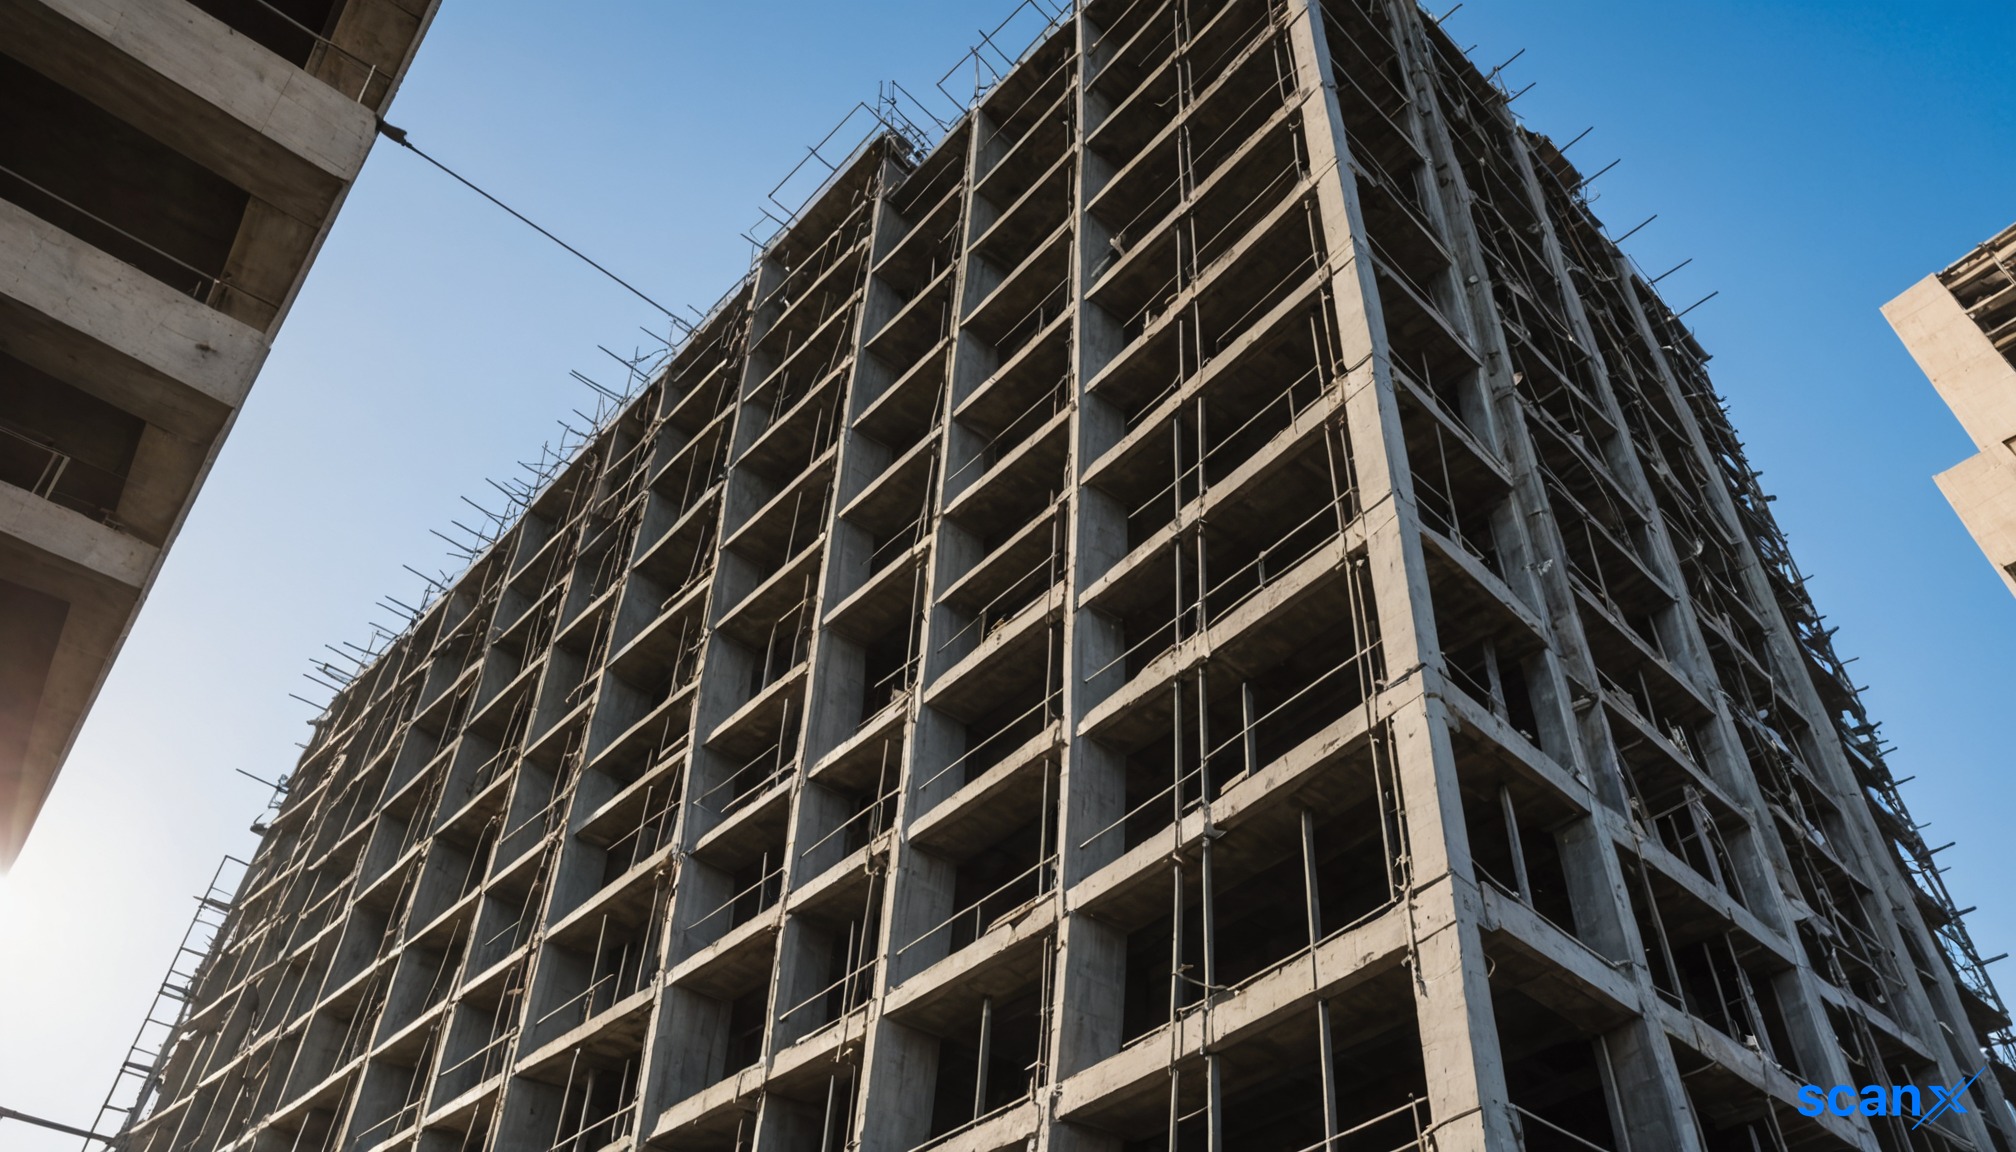
*this image is generated using AI for illustrative purposes only.
Godrej Properties reported a 41.8% year-on-year decline in consolidated net profit attributable to owners for the quarter ended June 30, 2026 (Q1FY26), dropping to ₹349.38 crore from ₹598.40 crore in the corresponding period of FY25. The contraction occurred despite a 16.5% increase in revenue from operations to ₹506.17 crore, signaling significant margin compression within the core real estate business where pre-tax profits fell sharply from ₹855.58 crore to ₹472.83 crore.
The Board of Directors approved the unaudited standalone and consolidated financial results on August 04, 2026. The results were reviewed by the Audit Committee and subjected to limited review by B S R & Co. LLP, the statutory auditors. Statutory auditor Aniruddha Godbole issued an unmodified conclusion, confirming compliance with Indian Accounting Standards (Ind AS) and SEBI Listing Regulations.
Financial Performance Highlights
Consolidated revenue from operations rose to ₹506.17 crore in Q1FY26, up from ₹434.56 crore in Q1FY25. However, total income declined by 17.0% to ₹1,345.04 crore from ₹1,620.34 crore, largely due to a drop in other income. Other income stood at ₹838.87 crore compared to ₹1,185.78 crore in the prior year quarter. This decrease was partly attributed to fair value gains upon re-measurement of existing investments following the acquisition of control over one of its joint ventures during the quarter.
| Metric: | Q1FY26 (₹ Cr) | Q1FY25 (₹ Cr) | YoY Change |
|---|---|---|---|
| Revenue from Operations | 506.17 | 434.56 | +16.5% |
| Total Income | 1,345.04 | 1,620.34 | -17.0% |
| Profit Before Tax | 479.71 | 860.57 | -44.3% |
| Net Profit (PAT) | 349.38 | 598.40 | -41.8% |
On a standalone basis, net profit increased marginally to ₹60.54 crore from ₹56.11 crore in Q1FY25. Standalone revenue from operations grew 14.2% to ₹121.09 crore from ₹106.07 crore. Standalone other income remained robust at ₹464.67 crore, slightly down from ₹471.38 crore in the previous year's quarter.
Segmental Analysis and Operational Metrics
The real estate segment generated revenue of ₹476.25 crore, up from ₹406.96 crore in Q1FY25. However, the segment's pre-tax result declined by 44.7% to ₹472.83 crore from ₹855.58 crore. The hospitality segment contributed ₹29.92 crore in revenue and ₹6.88 crore in pre-tax profit, showing modest growth compared to ₹27.60 crore and ₹4.99 crore respectively in the prior year.
Key financial ratios indicate tightening liquidity coverage. The Debt Service Coverage Ratio (DSCR) fell to 0.26 from 3.13 in Q1FY25, while the Interest Service Coverage Ratio (ISCR) decreased to 1.56 from 3.13. The gross debt-to-equity ratio increased slightly to 0.97 from 0.78, reflecting higher leverage relative to equity.
Corporate Developments and Disclosures
Statutory auditors highlighted that managerial remuneration exceeded limits under Section 197 of the Companies Act, 2013. The excess remuneration paid to the Executive Chairperson for the year ended March 31, 2026, was ₹21.76 crore, including an additional provision of ₹0.19 crore recognized in Q1FY26. Furthermore, commission amounting to ₹2.00 crore was paid to non-executive directors. Shareholder approval for these waivers is sought at the forthcoming Annual General Meeting.
Additionally, the National Company Law Tribunal (NCLT) ordered the merger of Embellish Houses Private Limited with Godrej Properties Limited, effective November 1, 2025. The company is currently completing necessary formalities with the Registrar of Companies to make the scheme effective and has not yet accounted for this merger in the Q1FY26 results.
What the Numbers Show
The divergence between rising operational revenue and falling pre-tax profits in the real estate segment suggests a compression in operating margins or timing differences in profit recognition. While top-line growth indicates sustained demand or project launches, the nearly 45% drop in segment profitability points to higher costs or lower-margin sales mix. The reliance on other income, particularly fair value gains from JV acquisitions, remains a critical component of total income, masking the underlying operational slowdown in the core real estate business.
Historical Stock Returns for Godrej Properties
| 1 Day | 5 Days | 1 Month | 6 Months | 1 Year | 5 Years |
|---|---|---|---|---|---|
| +0.61% | -3.61% | -18.79% | +6.72% | -20.83% | -29.57% |

How will the sharp decline in the Debt Service Coverage Ratio (DSCR) to 0.26 impact Godrej Properties' ability to secure new financing or refinance existing debt in the near term?
What specific operational cost drivers or changes in the sales mix are causing the significant margin compression in the core real estate segment despite rising revenue?
To what extent will the pending merger of Embellish Houses Private Limited affect the company's consolidated financials and leverage ratios once accounted for in future quarters?
 20
20






 Access 50+ Readymade Screeners
  Use 200+ Custom Filters
  Get Full Market Insights





