

GNG Electronics reports 32% revenue surge in Q1FY27 on margin expansion


GNG Electronics Limited posted strong Q1FY27 results with revenue growing 32% to ₹412.5 crore and PAT surging 56% to ₹28.9 crore. Gross margins expanded significantly to 24.65% due to better procurement and international mix. The company raised its FY27 revenue guidance and highlighted structural tailwinds in the refurbished PC market driven by rising new device costs.

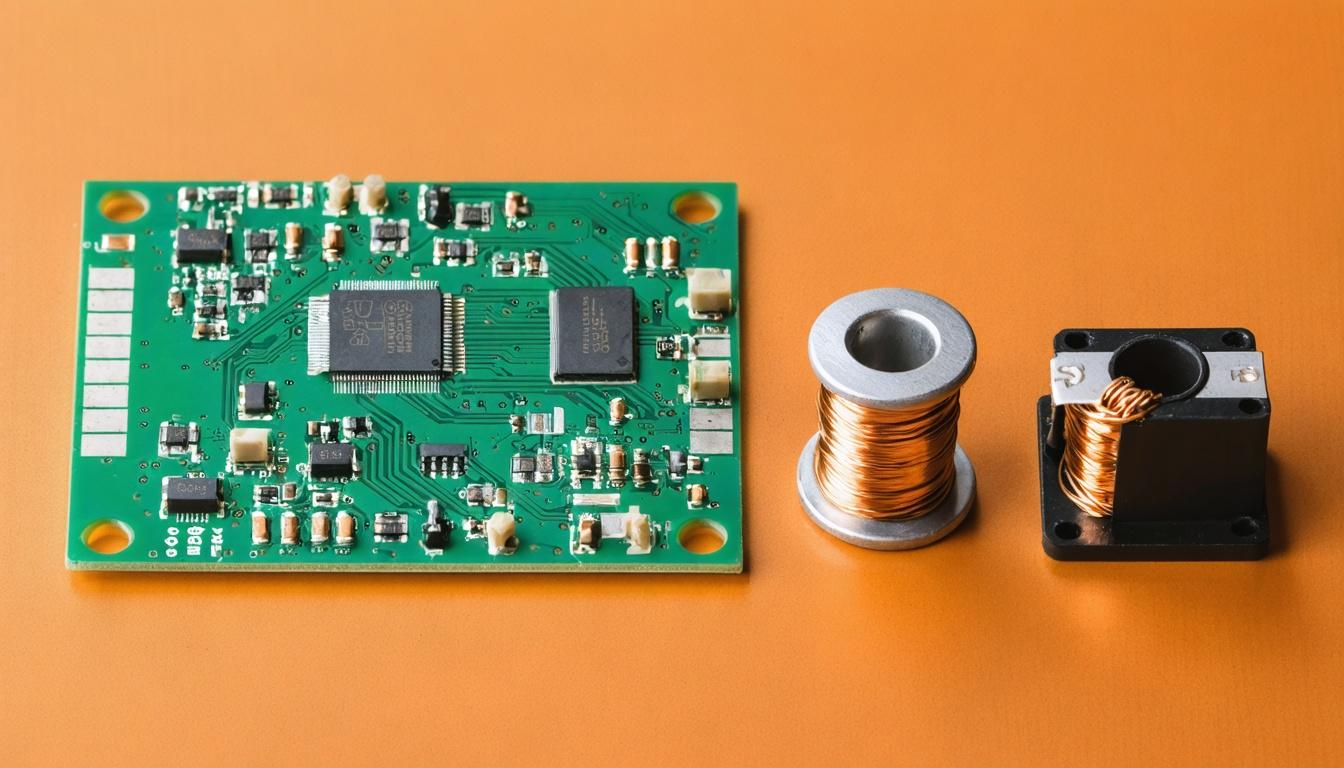

*this image is generated using AI for illustrative purposes only.
GNG Electronics Limited delivered a robust start to fiscal year 2027, reporting a 32% year-on-year growth in consolidated revenue to ₹412.5 crore for the quarter ended June 30, 2026 (Q1FY27). Profit after tax (PAT) surged 56% to ₹28.9 crore, driven by significant gross margin expansion and strong demand across international markets including the United States, Europe, and the Middle East. The company also raised its full-year FY27 revenue guidance from 25–30% to a higher band, citing structural tailwinds in the premium refurbished computing sector.
The results were reviewed by the Audit Committee and approved by the Board of Directors on July 30, 2026. Statutory auditors Shankarlal Jain & Associates LLP issued an unmodified limited review report. The financials were published in Financial Express and Loksatta on August 01, 2026, pursuant to Regulation 47 of the SEBI (Listing Obligations and Disclosure Requirements) Regulations, 2015. An earnings call with analysts and investors was held on July 30, 2026, moderated by Motilal Oswal Financial Services.
Financial Performance
Consolidated revenue from operations grew 32% year-on-year to ₹412.5 crore from ₹312.3 crore in Q1FY26. Gross profit stood at ₹101.6 crore, with gross margins expanding by 329 basis points year-on-year to 24.65%. This improvement was attributed to better procurement strategies and improved realization across markets.
EBITDA increased by 50.4% to ₹52.8 crore, with EBITDA margins improving by 156 basis points to 12.8%. Net profit after tax rose sharply to ₹28.9 crore from ₹18.5 crore in the corresponding previous quarter, reflecting a PAT margin expansion of 108 basis points to 7%.
| Particulars (₹ Cr): | Q1FY27 | Q1FY26 | YoY Change |
|---|---|---|---|
| Revenue from Operations | 412.5 | 312.3 | 32.1% |
| Gross Profit | 101.6 | — | — |
| EBITDA | 52.8 | 35.2 | 50.4% |
| Profit After Tax (PAT) | 28.9 | 18.5 | 56.2% |
On a standalone basis, net profit was ₹15.9 crore compared to ₹10.2 crore in Q1FY26. Basic EPS for the quarter was ₹2.54.
Operational Highlights and Market Dynamics
Managing Director Sharad Khandelwal highlighted that the company’s performance was bolstered by rising memory prices, which have increased fivefold since October 2025. DDR5 memory prices rose 5–10% in the quarter alone, pushing new PC prices up significantly. This has accelerated consumer and enterprise shift towards Electronics Bazaar’s premium refurbished devices, which offer reliability and warranty at lower costs.
The company supplies to 49 countries, up from 46 in FY26. Customer touchpoints grew to 5,130, and the supplier base expanded to 773. Employee count increased to 2,420 as of June 2026. In terms of product mix, laptops accounted for 81% of revenue realization, with total unit shipments reaching approximately 1.5 lakh units (1.08 lakh laptops and 42,000 desktops/others).
Geographic revenue split showed 36% from India, 12% from the Middle East, and 47% from the US and Europe combined. Average Selling Price (ASP) for laptops rose 12% year-on-year to ₹30,763, driven by product mix and brand trust.
Strategic Outlook and Guidance
Management revised its full-year FY27 revenue growth guidance upwards. Previously projected at 25–30%, the new guidance reflects confidence in sustained demand and margin leverage. PAT margin growth is now expected to improve by 0.5–0.75 percentage points over the previous year.
Khandelwal emphasized that the business is moving away from commoditization, leveraging trust and warranty as key margin drivers. The company maintains strategic inventory levels, currently around ₹700 crore, to capitalize on price uptrends and ensure instant delivery capabilities. While working capital remains heavy due to procurement cycles, management indicated that operating leverage will kick in as employee productivity scales.
What the Numbers Show
The significant divergence between revenue growth (32%) and volume growth (~18%) underscores the impact of ASP expansion and geographic mix shift towards higher-margin developed markets. The gross margin expansion of 329 basis points is primarily driven by the ability to procure inventory ahead of price hikes and sell at premium realizations in the US and Europe. However, net debt increased slightly to ₹406 crore from ₹399 crore, reflecting strategic inventory buildup rather than operational strain. The rise in other expenses by 68% is linked to incentivization for sales realization, which management views as a necessary investment for long-term market penetration.
Historical Stock Returns for GNG Electronics
| 1 Day | 5 Days | 1 Month | 6 Months | 1 Year | 5 Years |
|---|---|---|---|---|---|
| +2.61% | -1.46% | +10.96% | +100.17% | +102.53% | +111.37% |

How sustainable is the current gross margin expansion given the potential for DDR5 memory prices to stabilize or decline in future quarters?
What specific strategies will GNG Electronics employ to manage its increasing net debt and heavy working capital requirements as it scales inventory levels?
Could the company's heavy reliance on the US and European markets (47% of revenue) expose it to heightened risks from trade tariffs or regulatory changes in those regions?
 20
20









 Create Custom Screeners
  Access 200+ Pre-built Filters
  Use 50+ Readymade Screener





