

GMR Power & Urban Infra files FY26 business responsibility report


- Standalone turnover reported at ₹367.28 crore for FY26
- Energy generation contributes 73.75% of total revenue
- Scope 1 emissions rose to 1,16,04,048 MT CO2e
- Zero fatalities recorded across employee workforce
- Related-party loans increased to 99.98% of total advances

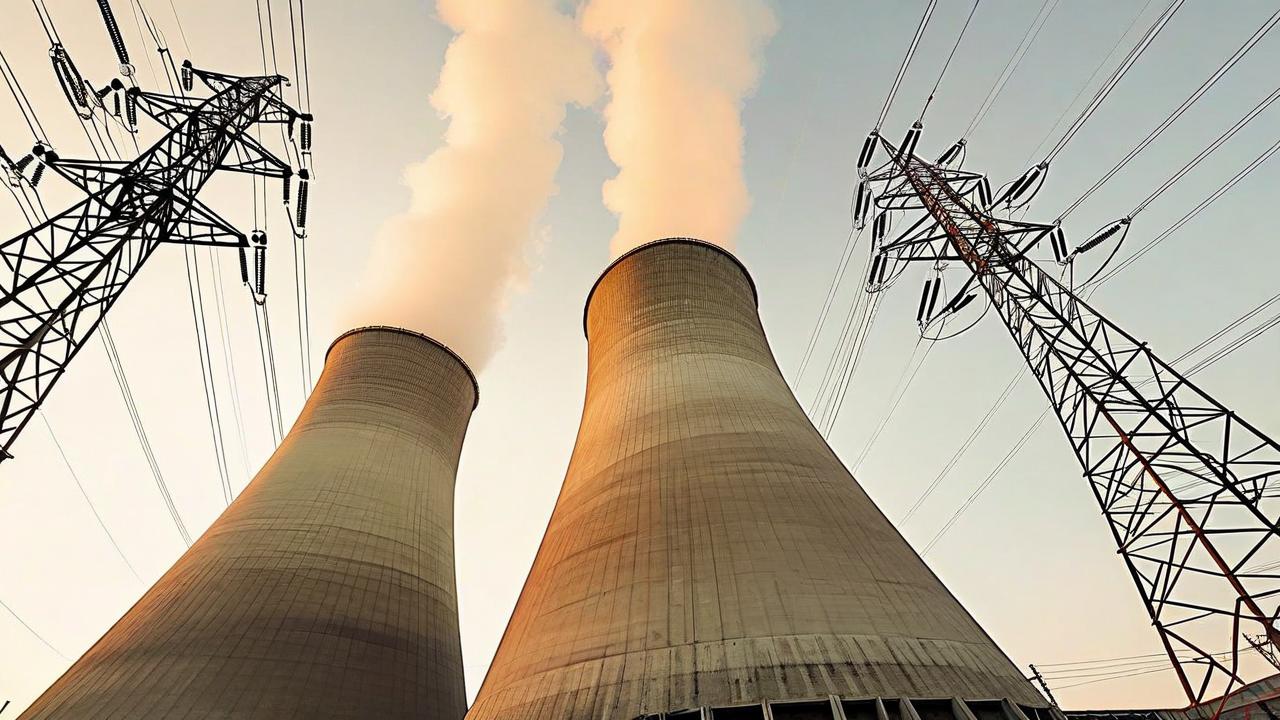

*this image is generated using AI for illustrative purposes only.
GMR Power & Urban Infra Limited filed its Business Responsibility and Sustainability Report (BRSR) for FY26 with stock exchanges on August 27, 2026. The disclosure covers consolidated operations across power generation, smart metering, and highways.
The company reported a standalone turnover of ₹367.28 crore and a net worth of ₹13,416.47 crore for the period. CSR obligations remain applicable under Section 135 of the Companies Act, 2013.
Operational Footprint
Energy generation accounts for 73.75% of turnover, followed by smart meter infrastructure at 19.34%. Road transport and EPC services contribute 2.98% and 3.93% respectively. The entity operates 13 plants and 26 offices nationally, with three international offices.
Environmental Metrics
Total energy consumption rose to 1,20,741,623 GJ in FY26 from 1,14,375,395 GJ in FY25. Energy intensity per rupee of turnover improved to 16,468 GJ/₹ crore, down from 18,029 GJ/₹ crore. Scope 1 emissions increased to 1,16,04,048 metric tonnes of CO2 equivalent.
| Metric | FY26 | FY25 |
|---|---|---|
| Total Energy Consumed (GJ) | 1,20,741,623 | 1,14,375,395 |
| Scope 1 Emissions (MT CO2e) | 1,16,04,048 | 1,07,61,931 |
| Water Withdrawal (KL) | 2,67,25,923 | 2,32,40,696 |
Workforce and Safety
The company employed 981 permanent staff, with women comprising 8% of the workforce. Turnover rate for permanent employees stood at 15% in FY26, up from 14% in FY25. No fatalities or lost-time injuries were recorded among employees.
What the Numbers Show
Related-party loans and advances surged to 99.98% of total loans in FY26, a sharp rise from 42.88% in FY25. This indicates a significant shift in capital deployment toward affiliated entities during the fiscal year.
Historical Stock Returns for GMR Power & Urban Infra
| 1 Day | 5 Days | 1 Month | 6 Months | 1 Year | 5 Years |
|---|---|---|---|---|---|
| +1.02% | -3.70% | +2.60% | -6.23% | -12.66% | +115.13% |

How will the sharp increase in related-party loans to 99.98% impact GMR's liquidity position and financial independence in FY27?
What specific strategies is GMR implementing to reduce Scope 1 emissions given the 7.8% year-over-year increase despite improved energy intensity?
Will the company introduce new initiatives to address the low 8% female workforce representation and stabilize the rising employee turnover rate?
 15
15







 Access Market Heat-map & Insights
  Create, Save & Share your Screener
  Use 200+ Screening Filters





