Glen Industries Reports Strong H2 FY26 Growth with ₹107.57 Crore Revenue


Glen Industries Limited delivered strong financial performance with H2 FY26 revenue of ₹107.57 crore (39.12% YoY growth) and FY26 revenue of ₹203.13 crore (19.02% YoY growth). The company is expanding capacity significantly from 7,986 MT to 21,095 MT for food containers and adding 7,696 MT paper cups capacity to transition from capacity-constrained to scale-led growth model.
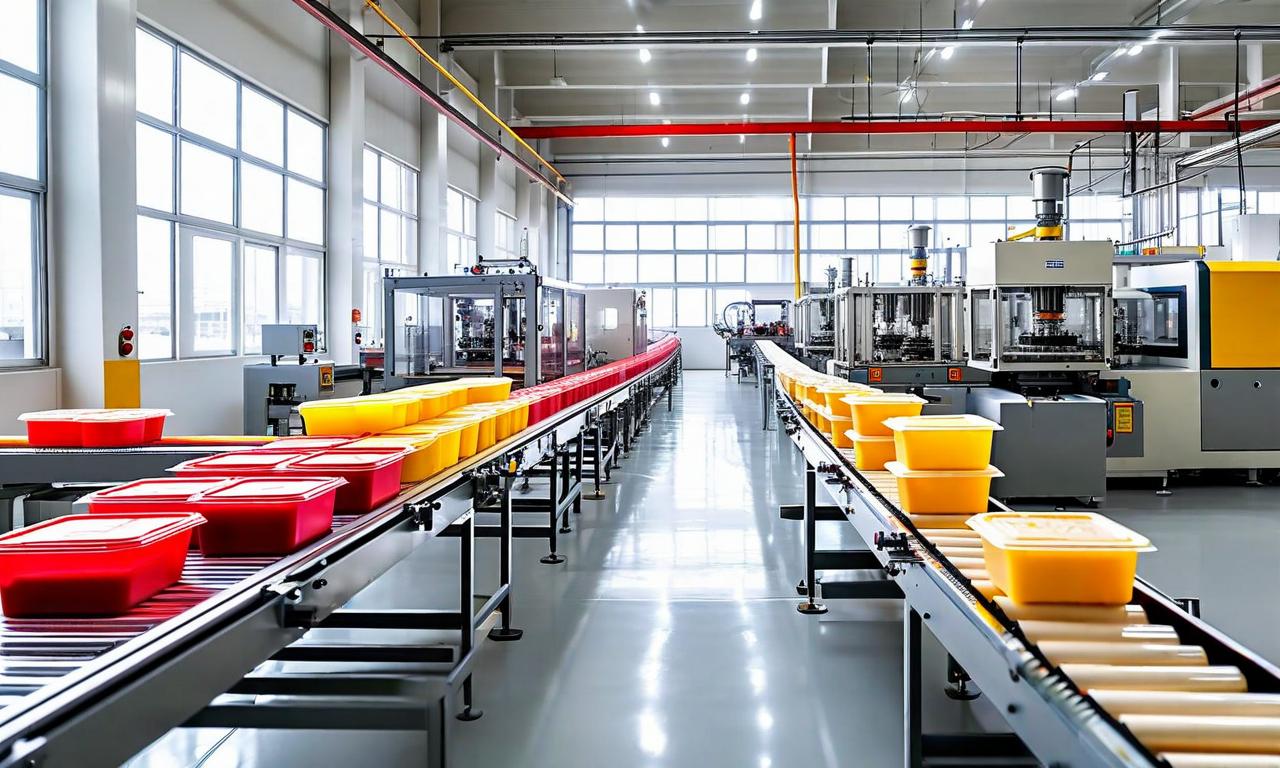

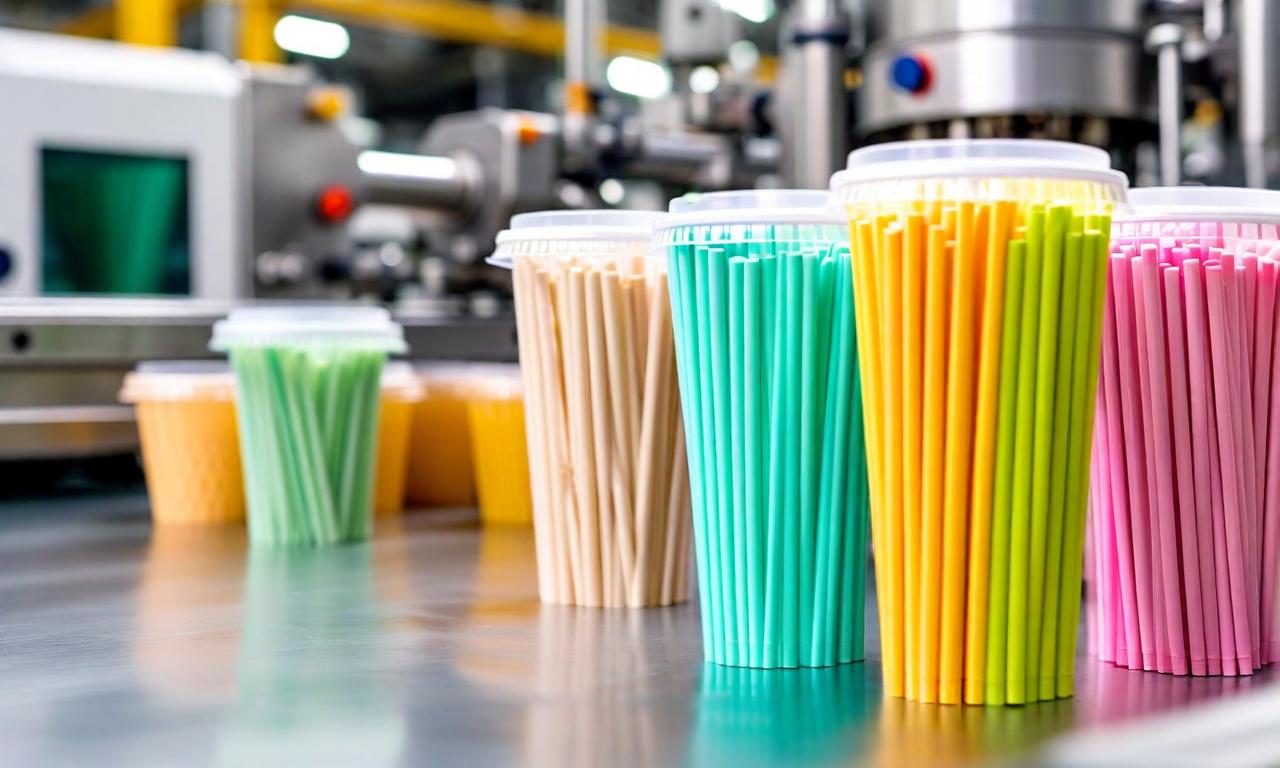
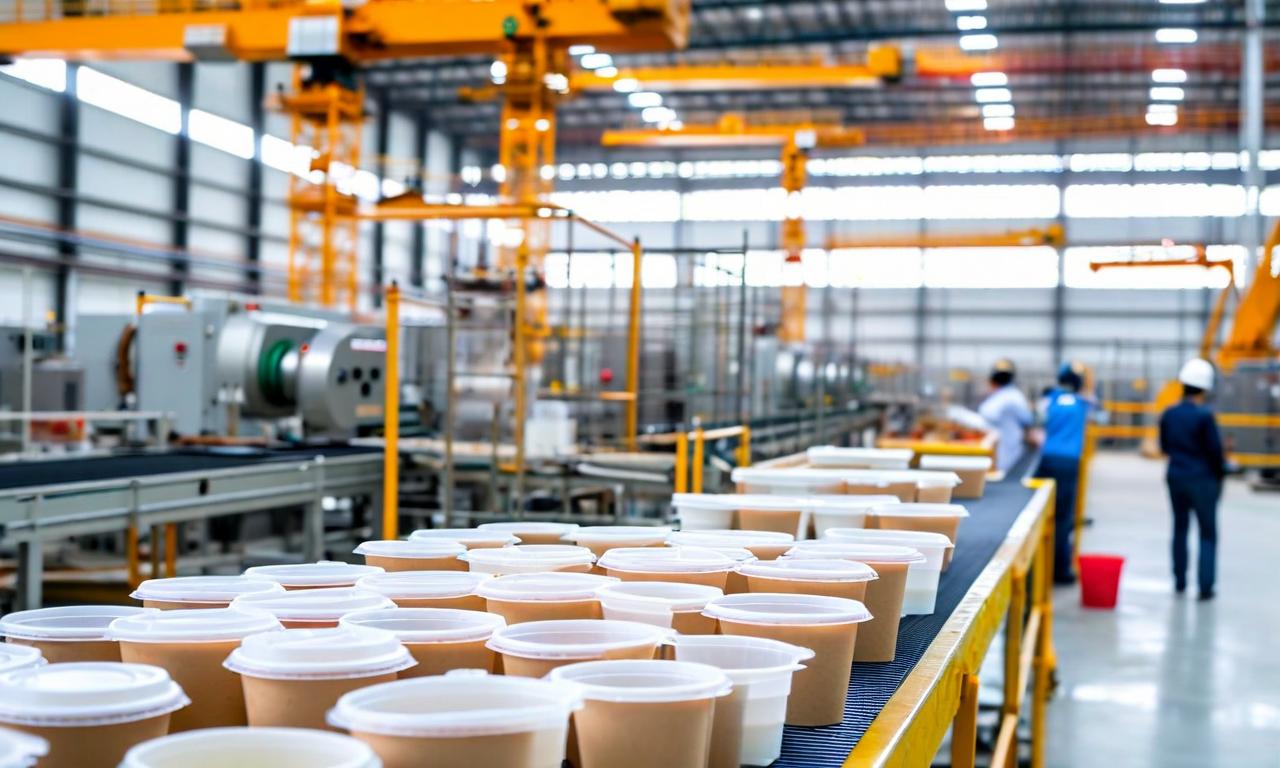
*this image is generated using AI for illustrative purposes only.
Glen Industries Limited has delivered exceptional financial performance in H2 FY26 and the full fiscal year, demonstrating robust growth in the sustainable packaging sector. The company's business update, filed under Regulation 30 of SEBI regulations, highlights significant revenue expansion and strategic capacity enhancement initiatives.
Financial Performance Overview
The company reported strong financial results across both periods, with H2 FY26 showing particularly impressive growth momentum:
| Period: | Revenue | YoY Growth |
|---|---|---|
| H2 FY26: | ₹107.57 crore | 39.12% |
| FY26: | ₹203.13 crore | 19.02% |
Operational Metrics and Capacity Utilization
Glen Industries operates with strong capacity utilization across its product portfolio, with thin-wall containers leading the performance:
| Product Category: | Capacity Utilization (FY26) | Previous Year |
|---|---|---|
| Thin Wall Containers: | ~78% | ~76% (FY25) |
| PLA Straws: | ~28% | - |
| Paper Straws: | ~32% | - |
The company maintains a diversified revenue mix with domestic operations contributing approximately 72.63% of revenue, while exports account for around 27.37% with presence across 30+ countries.
Strategic Capacity Expansion Initiative
Glen Industries is undertaking significant capacity expansion to transition from a capacity-constrained model to scale-led growth:
| Expansion Details: | Current Capacity | Post-Expansion |
|---|---|---|
| Food Containers: | 7,986 MT | 21,095 MT |
| PLA Straws: | 1,928 MT | 1,928 MT |
| Paper Straws: | 1,134 MT | 1,134 MT |
| Paper Cups (New): | - | 7,696 MT |
Market Position and Growth Drivers
The revenue growth has been primarily driven by strong demand for thin-wall food containers, which contribute over 70% of the company's revenue. This demand surge reflects the growing preference for sustainable packaging solutions in the QSR, takeaway, and food delivery ecosystem. The company's export order book provides visibility of approximately 1.5-1.6 million with 3-month forward visibility.
Future Outlook
Management expects the capacity expansion to drive growth from FY27 onwards, supported by strong demand from existing customers and expansion in export markets. The company anticipates stable margins through operating leverage, improved product mix, and scale benefits as it transitions to a scale-driven packaging platform.
Historical Stock Returns for Glen Industries
| 1 Day | 5 Days | 1 Month | 6 Months | 1 Year | 5 Years |
|---|---|---|---|---|---|
| +1.35% | +10.48% | -1.46% | -5.30% | -43.01% | -52.14% |
How will Glen Industries' massive capacity expansion impact competitive dynamics in India's sustainable packaging market?
What specific strategies will the company deploy to improve PLA and paper straw utilization rates from their current sub-35% levels?
Could the introduction of paper cups create margin pressure given the company's expectation of stable margins through product mix improvements?
 20
20