

Gladstone Commercial Q2FY26 Results: FFO per share rises to $0.38


- FFO and core FFO per share both reached $0.38 in Q2FY26, up from $0.33 and $0.35 in the prior year.
- Operating revenues increased to $44 million from $39.5 million, aided by a $1.9 million one-time termination fee.
- Industrial concentration rose to 69% of annualized straight-line rent following the acquisition of a Newport News facility.
- Portfolio occupancy remained strong at 98.7% with a weighted average lease term exceeding 7.1 years.

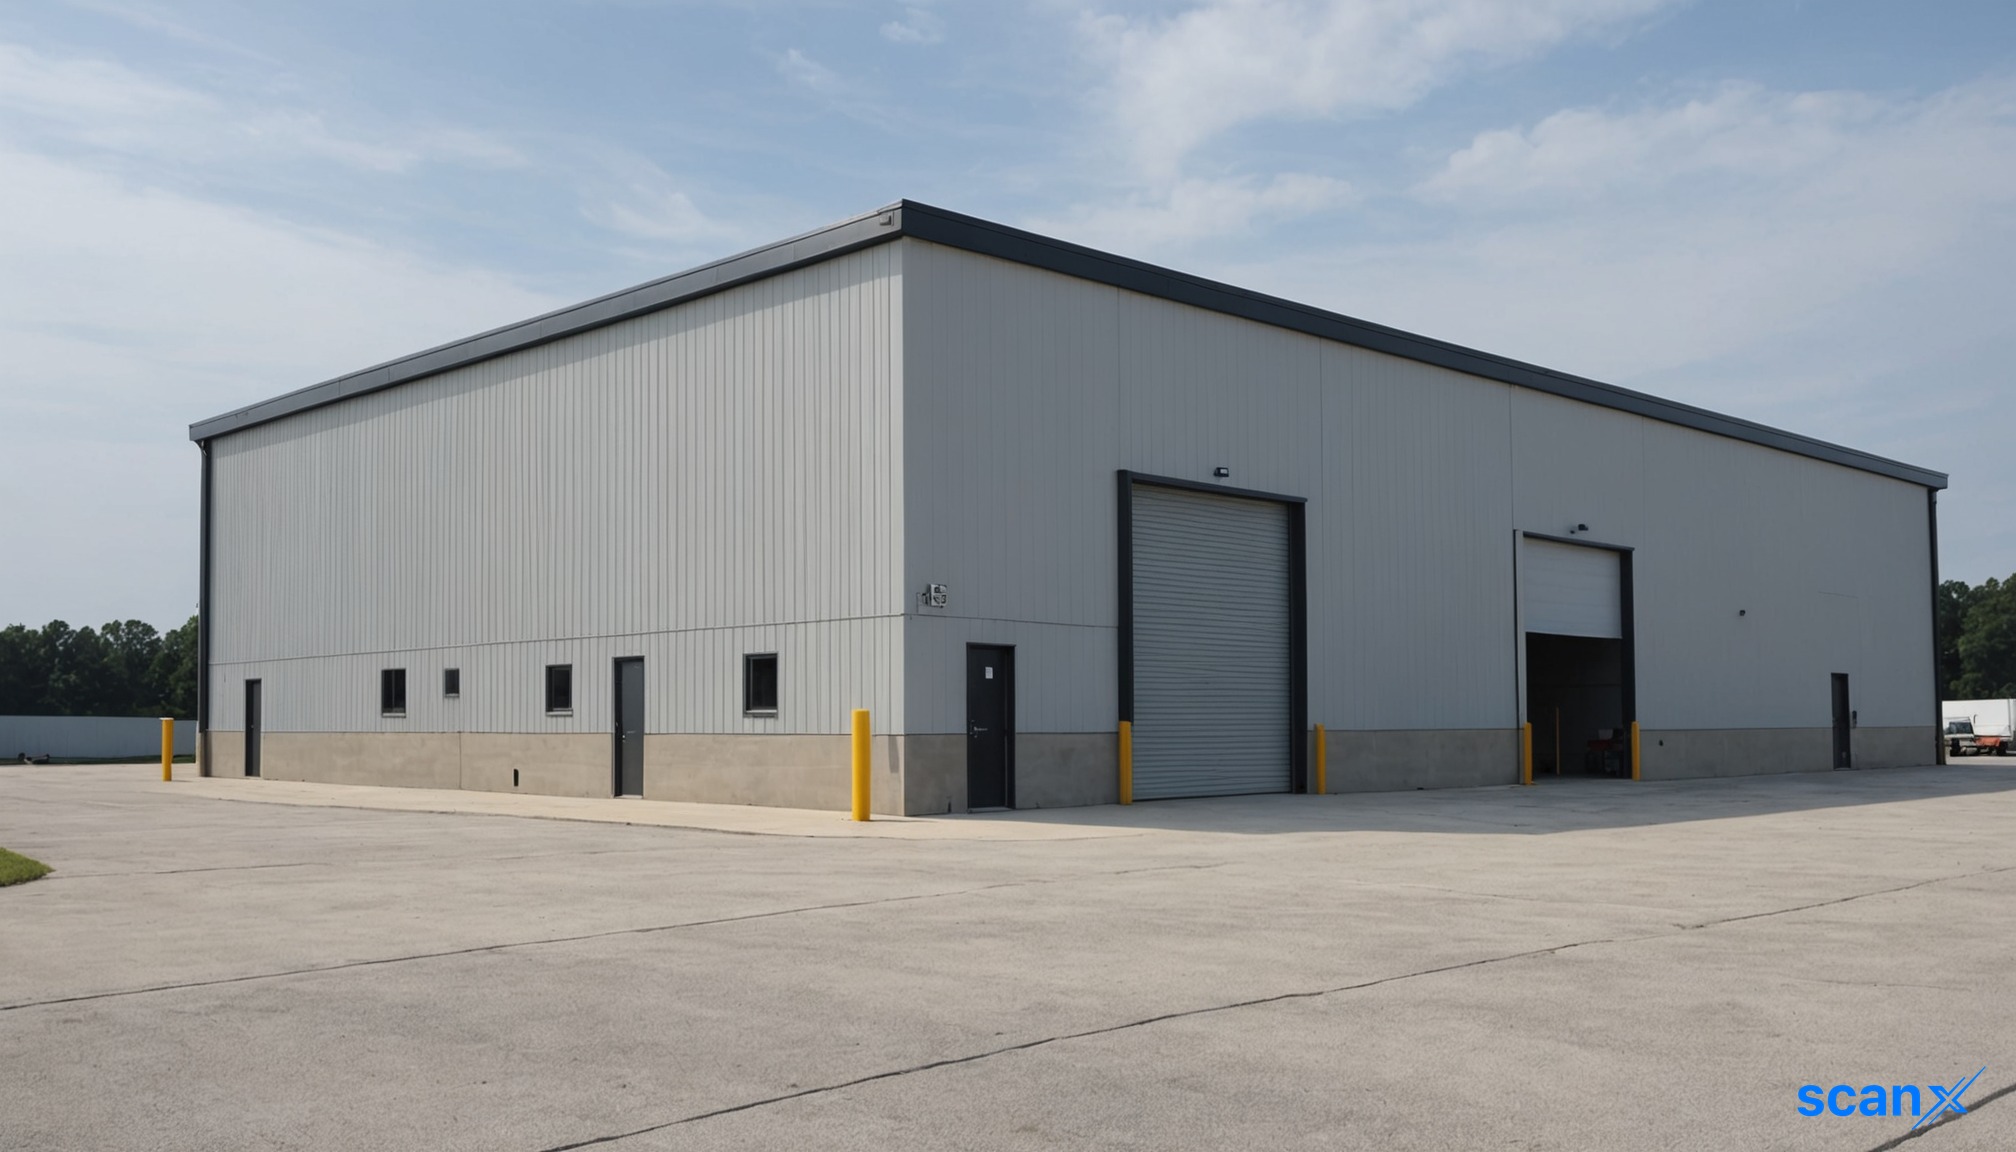

*this image is generated using AI for illustrative purposes only.
Gladstone Commercial Corporation reported funds from operations (FFO) and core FFO per share of $0.38 for the second quarter of fiscal year 2026, an increase from $0.33 and $0.35 respectively in the comparable period last year. The real estate investment trust maintained a high portfolio occupancy rate of 98.7% while advancing its strategy to increase industrial asset concentration.
Operating revenues rose to $44 million from $39.5 million in the prior year quarter, driven by portfolio growth, higher rental rates, and a one-time termination fee related to a property sale. Operating expenses increased to $26.2 million from $25.1 million, primarily due to higher depreciation associated with the larger portfolio and incentive fees paid during the period.
Asset Recycling and Portfolio Metrics
The company executed strategic asset recycling during the quarter, acquiring a 153,890-square-foot industrial property in Newport News, Virginia, for $22.75 million. This facility is leased to Huntington Ingalls Industries. Simultaneously, Gladstone sold a 161,458-square-foot industrial building in Monroe, North Carolina, to tenant Assa Abloy. The Newport News acquisition represents nearly double the cash and straight-line rents generated by the disposed North Carolina asset.
Subsequent to the quarter-end, the company acquired a 146,650-square-foot industrial property in Red Bud, Illinois, for $6.5 million. These transactions bring the industrial concentration to 69% of annualized straight-line rent, approaching the near-term goal of 70%. The weighted average lease term (WALT) for the portfolio stands at over 7.1 years.
| Metric | Q2FY26 | Q2FY25 | Change |
|---|---|---|---|
| FFO per share | $0.38 | $0.33 | +$0.05 |
| Core FFO per share | $0.38 | $0.35 | +$0.03 |
| Operating Revenues | $44 million | $39.5 million | +$4.5 million |
| Operating Expenses | $26.2 million | $25.1 million | +$1.1 million |
| Portfolio Occupancy | 98.7% | N/A | N/A |
Capital Structure and Liquidity
Management funded the Newport News acquisition using internally generated cash flow without issuing equity, citing that the current stock price does not reflect the quality of the portfolio. As of the end of the quarter, the company had $51.57 million in revolver borrowings outstanding. The debt profile consists of 47% fixed rate, 47% hedged floating rate, and 6% floating rate debt.
The effective average SOFR was 3.68% as of June 30. Liquidity positions include approximately $8.4 million in cash and $68.8 million of availability under the line of credit. Loan maturities total $17.7 million for 2026 and $51.9 million through the second quarter of 2027. The quarterly dividend remains at $0.30 per share, or $1.20 annually.
What the Numbers Show
A notable divergence exists between revenue growth drivers and expense pressures. While operating revenues increased by $4.5 million, this figure includes a $1.9 million one-time termination fee recognized from the sale of the Monroe, North Carolina property. Excluding this non-recurring item, the underlying operational revenue growth is more modest, suggesting that the reported top-line expansion is partially supported by asset disposal activities rather than solely organic leasing gains. Furthermore, the payout ratio sits just under 80%, providing management with internal cash flow capacity to fund future acquisitions without dilutive equity issuance.

How will the approaching $51.9 million in debt maturities through Q2 2027 impact Gladstone's ability to fund future acquisitions without equity dilution?
What is the sustainability of the current dividend payout ratio if the one-time termination fees are excluded from future quarterly results?
How does the shift toward 69% industrial concentration affect Gladstone's risk exposure compared to peers with higher office or retail allocations?





 Access Market Heat-map & Insights
  Create, Save & Share your Screener
  Use 200+ Screening Filters





