

Garware Technical Fibres consolidated net profit rises 21.5% in Q1FY26


Garware Technical Fibres consolidated net profit rose 21.5% to ₹6,460.30 lakh in Q1FY26, aided by offshore acquisitions. Standalone net profit declined 11.2% to ₹4,898.93 lakh. Synthetic cordage segment led revenue growth. The company completed a ₹109.99 crore share buyback in June 2026.


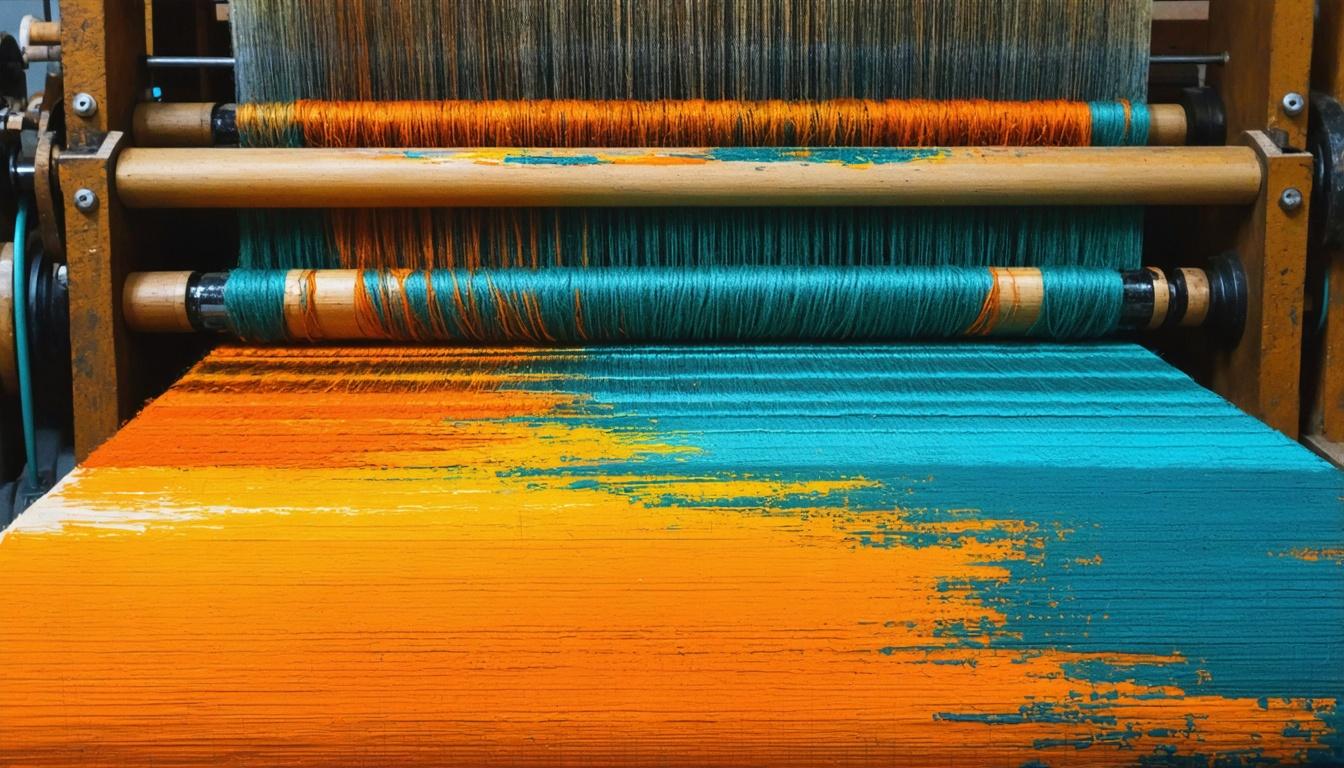
*this image is generated using AI for illustrative purposes only.
Garware Technical Fibres reported a consolidated net profit of ₹6,460.30 lakh for the quarter ended June 30, 2026, marking a 21.5% increase from ₹5,314.40 lakh in Q1FY25. The growth was primarily driven by a 29.3% year-on-year rise in total income to ₹49,129.79 lakh, bolstered by strong performance in the synthetic cordage segment and the consolidation of recently acquired offshore entities. Standalone net profit declined 11.2% to ₹4,898.93 lakh despite a 13.7% increase in standalone total income to ₹40,978.02 lakh, highlighting the material contribution of international operations to the group’s bottom line.
The Board of Directors approved the unaudited standalone and consolidated financial results at its meeting held on August 5, 2026. The results were filed with stock exchanges pursuant to Regulation 30 and Regulation 33 of the SEBI (Listing Obligations and Disclosure Requirements) Regulations, 2015. Mehta Chokshi & Shah LLP, the statutory auditors, conducted a limited review of the financial statements. Additionally, the company completed a buyback of 16,17,500 equity shares at ₹680 per share in June 2026, resulting in a cash outflow of ₹109.99 crore.
Financial Performance
Consolidated profit before tax stood at ₹8,636.18 lakh, up from ₹7,039.46 lakh in the prior year quarter. Tax expenses amounted to ₹2,175.88 lakh (net of deferred tax). Basic and diluted earnings per share (EPS) were ₹6.56 each, compared to ₹5.35 in Q1FY25. Total comprehensive income on a consolidated basis reached ₹10,688.82 lakh, significantly higher than ₹5,651.29 lakh in the previous year, driven by other comprehensive income items not reclassified to profit or loss.
Standalone profit before tax was ₹6,557.20 lakh, down from ₹7,174.63 lakh in Q1FY25. Standalone EPS fell to ₹4.97 from ₹5.56. Equity share capital remained at ₹9,764.83 lakh after the buyback reduction.
| Metric | Consolidated Q1FY26 (₹ Lakh) | Consolidated Q1FY25 (₹ Lakh) | Standalone Q1FY26 (₹ Lakh) | Standalone Q1FY25 (₹ Lakh) |
|---|---|---|---|---|
| Total Income | 49,129.79 | 38,006.62 | 40,978.02 | 36,039.46 |
| Net Profit After Tax | 6,460.30 | 5,314.40 | 4,898.93 | 5,515.73 |
| EPS (Basic & Diluted) | 6.56 | 5.35 | 4.97 | 5.56 |
Segment and Operational Insights
The synthetic cordage segment remains the primary revenue driver. Standalone segment revenue for synthetic cordage rose to ₹29,963.93 lakh from ₹25,964.49 lakh in Q1FY25. The fibre and industrial products & projects segment saw revenue increase to ₹10,900.29 lakh from ₹9,541.51 lakh. Consolidated synthetic cordage revenue reached ₹38,068.42 lakh, up from ₹27,882.93 lakh in the prior year quarter, reflecting the impact of acquisitions Offshore & Trawl System AS and Advanced Mooring System AS in Norway.
What the Numbers Show
The significant gap between standalone profitability (down 11.2%) and consolidated profitability (up 21.5%) underscores the strategic value of Garware Technical Fibres’ international expansion. The offshore acquisitions are offsetting domestic margin pressures, contributing substantially to the group’s net income. Additionally, total comprehensive income surged nearly 90% year-on-year, indicating strong performance in items not reclassified to profit or loss, likely related to foreign exchange or valuation adjustments from overseas operations. The completion of the ₹109.99 crore share buyback demonstrates management’s confidence in the company’s valuation and commitment to returning capital to shareholders.
Historical Stock Returns for Garware Technical Fibres
| 1 Day | 5 Days | 1 Month | 6 Months | 1 Year | 5 Years |
|---|---|---|---|---|---|
| -3.30% | -3.28% | -9.56% | +14.60% | -2.94% | -0.10% |

How will the integration of the Norwegian offshore entities impact Garware's long-term margin profile and operational synergies?
What specific factors are driving the decline in standalone profitability despite growth in domestic revenue, and can this trend be reversed?
Will the recent share buyback signal a shift in capital allocation strategy away from further aggressive international acquisitions?
 19
19











 Create Custom Screeners
  Access 200+ Pre-built Filters
  Use 50+ Readymade Screener





