

Finolex Industries files FY26 sustainability report; renewable energy share rises to 11.6%


- Renewable energy accounted for 11.6% of total electricity consumption in FY26
- Total waste generated rose to 18,876.25 metric tonnes, with 99.1% recovered
- Scope 1 emissions fell to 3,44,107 metric tonnes of CO2 equivalent
- The company recycled over 305,000 kilolitres of treated effluent
- Zero fatalities were recorded among employees and contractors

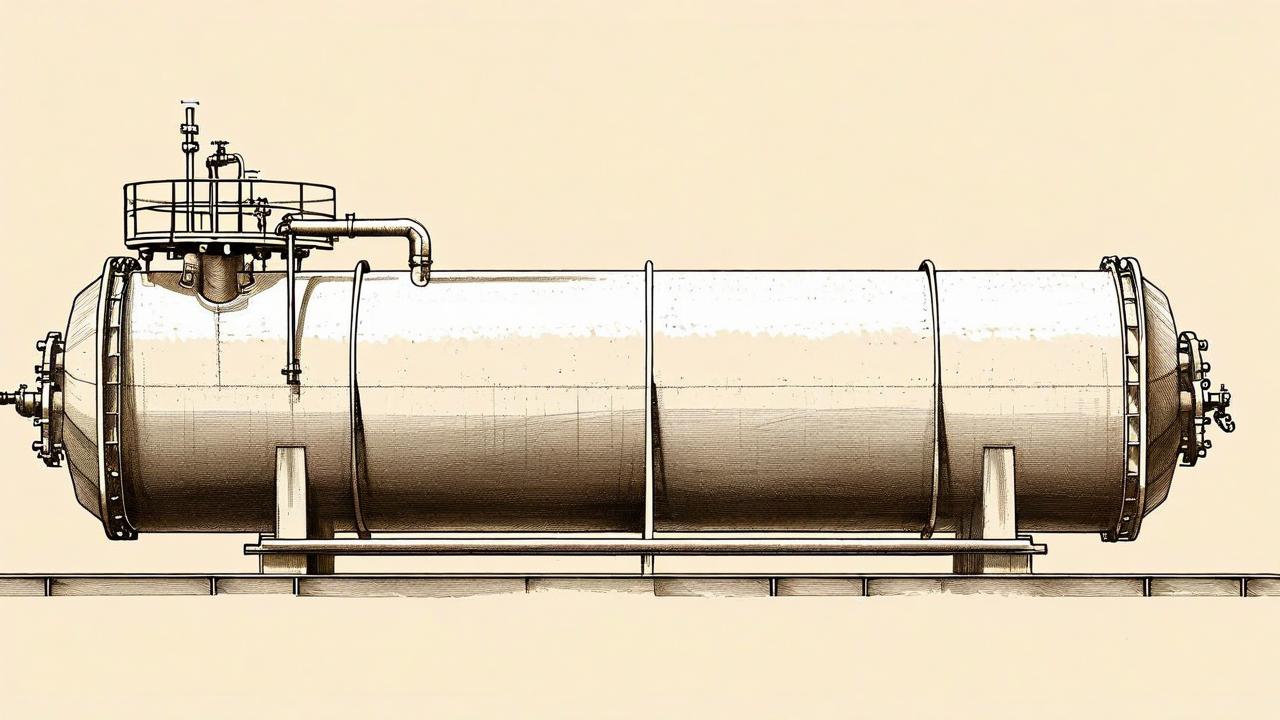

*this image is generated using AI for illustrative purposes only.
Finolex Industries submitted its Business Responsibility and Sustainability Report (BRSR) for FY26 on August 28, 2026. The filing details environmental, social, and governance metrics, including a rise in renewable energy consumption to 11.6% of total electricity usage.
The report covers the period from April 1, 2025, to March 31, 2026, and forms part of the company's 45th Annual Report. TUV SUD South Asia Private Limited provided reasonable assurance for the core attributes of the disclosure.
Environmental Performance
The company reported that renewable energy accounted for 11.6% of its total electricity consumption in FY26. This integration helped avoid over 39,000 metric tonnes of CO2 equivalent emissions. Additionally, biomass conservation initiatives cumulatively sequestered more than 22,000 metric tonnes of CO2e. Renewable Energy Certificates (RECs) procured under the Renewable Purchase Obligation mechanism reduced market-based Scope 2 emissions by approximately 15,000 metric tonnes of CO2e.
Water stewardship remained a strategic priority. The company recycled over 305,000 kilolitres of treated effluent within its facilities. It also harvested more than 2.37 million kilolitres of rainwater through direct and indirect recharge mechanisms. Total water withdrawal increased to 33,55,587 kilolitres from 32,03,286.28 kilolitres in the previous year.
Total energy consumption stood at 38,43,869.28 gigajoules, down from 40,00,396.13 gigajoules in FY25. Energy intensity per rupee of turnover adjusted for Purchasing Power Parity fell to 188.76 from 201.12.
Waste Management and Emissions
Total waste generated rose to 18,876.25 metric tonnes from 17,567.37 metric tonnes in FY25. Of this, 18,610.84 metric tonnes were recycled, and 197.67 metric tonnes were reused. Only 57.48 metric tonnes were disposed of through incineration or landfilling.
Scope 1 greenhouse gas emissions decreased to 3,44,107 metric tonnes of CO2 equivalent from 3,53,473.99 metric tonnes. Scope 2 emissions fell to 52,987 metric tonnes of CO2 equivalent from 54,106.07 metric tonnes.
Social and Governance Metrics
The company employed 1,132 permanent employees and 3,170 workers as of the end of FY26. Female representation among permanent employees was 3.71%, while it stood at 4.10% among workers. The turnover rate for permanent employees was 23.33%, compared to 22.02% in FY25.
Safety metrics showed zero employee and contractor fatalities across all manufacturing locations. The Lost Time Injury Frequency Rate (LTIFR) for workers was not disclosed for FY26, whereas it was 0.19 per one million-person hours worked in FY25.
Customer complaints totalled 1,113 during the year, all of which were resolved. Shareholder complaints numbered 52, with one pending resolution at the close of the year. No complaints were received regarding sexual harassment, discrimination, child labour, or forced labour.
What the Numbers Show
The divergence between rising waste generation and near-total recovery rates highlights operational efficiency in circularity. While total waste increased by 7.4% to 18,876.25 metric tonnes, the company recovered 99.1% of this volume through recycling and reuse. This suggests that production scaling did not compromise waste management protocols, as disposal volumes dropped significantly from 106.28 metric tonnes in FY25 to 57.48 metric tonnes in FY26.
Historical Stock Returns for Finolex Industries
| 1 Day | 5 Days | 1 Month | 6 Months | 1 Year | 5 Years |
|---|---|---|---|---|---|
| +0.93% | +0.45% | -4.24% | -7.78% | -22.39% | -34.05% |

How will Finolex Industries plan to accelerate its renewable energy mix beyond the current 11.6% to meet long-term net-zero targets?
What specific operational changes drove the 7.4% increase in total waste generation, and how sustainable is the current 99.1% recovery rate at higher production volumes?
Given the rise in total water withdrawal despite recycling efforts, what strategies is the company deploying to decouple water usage from production growth?
 20
20







 Access Market Heat-map & Insights
  Create, Save & Share your Screener
  Use 200+ Screening Filters





