

Filatex India FY26 Results: PAT rises 36.7% to ₹183.90 crore, EBITDA margin at 8.33%


- Filatex India reported PAT of ₹183.90 crore in FY26, up 36.7% YoY, with EBITDA rising 34.5% to ₹346.51 crore
- EBITDA margin expanded from 6.06% to 8.33% and PAT margin from 3.16% to 4.42%, driven by better product mix and cost discipline
- The Board approved a ₹690 crore capex programme including a ₹300 crore textile-to-textile chemical recycling plant through subsidiary Ecosis, targeted for commissioning in October 2026
- Debt-equity ratio declined to 0.08 in FY26 from 0.09 in FY25, continuing a multi-year deleveraging trend
- Final dividend of ₹0.30 per equity share recommended for FY26, subject to shareholder approval



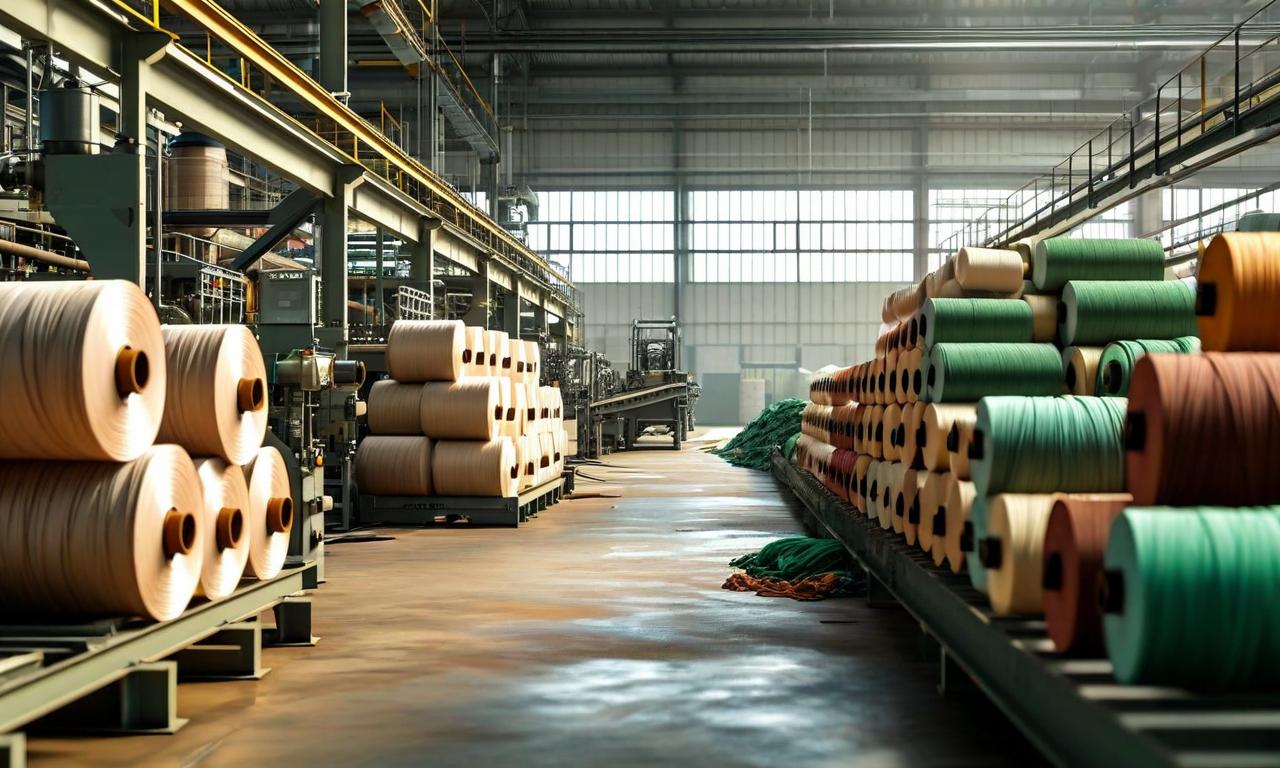
*this image is generated using AI for illustrative purposes only.
Filatex India delivered a strong FY26 performance, with profit after tax rising 36.7% to ₹183.90 crore and EBITDA growing 34.5% to ₹346.51 crore, even as revenue from operations edged down to ₹4,160.52 crore.
Financial Performance Overview
FY26 marked a year of meaningful margin improvement for Filatex India Limited. Despite a modest decline in revenue from ₹4,252.15 crore in FY25 to ₹4,160.52 crore in FY26, profitability improved sharply across all key metrics. EBITDA margin expanded from 6.06% in FY25 to 8.33% in FY26, while PAT margin rose from 3.16% to 4.42%. The company attributed the improvement to a better product mix, disciplined cost control and operating efficiency.
The following table summarises key financial metrics over the past four years:
| Metric | FY23 | FY24 | FY25 | FY26 |
|---|---|---|---|---|
| Revenue from Operations (₹ crore) | 4,303.87 | 4,285.90 | 4,252.15 | 4,160.52 |
| EBITDA (₹ crore) | 231.98 | 239.15 | 257.70 | 346.51 |
| EBITDA Margin (%) | 5.39 | 5.58 | 6.06 | 8.33 |
| PBT (₹ crore) | 122.08 | 150.43 | 180.21 | 246.31 |
| PBT Margin (%) | 2.84 | 3.51 | 4.24 | 5.92 |
| PAT (₹ crore) | 89.90 | 110.66 | 134.57 | 183.90 |
| PAT Margin (%) | 2.09 | 2.58 | 3.16 | 4.42 |
Quarterly Financial Performance
The company's quarterly numbers for FY26 are presented below:
| Metric | Q1FY26 | Q2FY26 | Q3FY26 | Q4FY26 |
|---|---|---|---|---|
| Revenue from Operations (₹ crore) | 1,049.40 | 1,075.93 | 1,049.70 | 985.49 |
| EBITDA (₹ crore) | 77.76 | 88.93 | 93.58 | 86.24 |
| PBT (₹ crore) | 54.89 | 63.79 | 74.16 | 53.47 |
| PAT (₹ crore) | 40.73 | 47.58 | 55.34 | 40.25 |
| Production (MT) | 94,996 | 99,973 | 96,979 | 97,079 |
| Sales (MT) | 97,263 | 1,01,391 | 1,00,318 | 89,841 |
Volume and Balance Sheet Strength
Sales volume remained broadly steady at 3,88,813 MT in FY26, compared with 3,90,210 MT in FY25, while production stood at 3,89,027 MT. Capacity utilisation was sustained at over 90% across both manufacturing facilities at Dahej, Gujarat, and Dadra and Nagar Haveli.
The company's balance sheet continued to strengthen. The debt-equity ratio declined from 0.09 in FY25 to 0.08 in FY26, continuing a multi-year deleveraging trend from 0.33 in FY22. Return on equity improved from 10.62% to 12.96%, and return on capital employed rose from 12.53% to 14.90%.
Key Financial Ratios
| Ratio | FY26 | FY25 | Change |
|---|---|---|---|
| Current Ratio (times) | 1.44 | 1.40 | +2.86% |
| Debt Equity Ratio (times) | 0.08 | 0.09 | -11.11% |
| Debt Service Coverage Ratio (times) | 5.27 | 4.46 | +18.16% |
| Return on Equity (%) | 12.96% | 10.62% | +22.03% |
| Net Profit Ratio (%) | 4.42% | 3.16% | +39.87% |
| Return on Capital Employed (%) | 14.90% | 12.53% | +18.91% |
Capital Expenditure Programme
During FY26, the Board approved a capital expenditure programme of approximately ₹690 crore, funded through debt of approximately ₹335 crore with the balance from internal accruals. The programme spans five initiatives:
| Project | Investment | Capacity / Outcome | Status |
|---|---|---|---|
| Ecosis textile-to-textile chemical recycling, Dahej | ₹300 crore | 27,000 TPA recycled polyester | Under implementation |
| Brownfield expansion of PFY (POY, FDY and DTY) | ₹235 crore | Additional 55,000 TPA | Under implementation |
| Monetisation of surplus steam | ₹85 crore | Surplus steam from 30 MW captive plant supplied to neighbouring units | Under implementation |
| Renewable energy | ₹30 crore | Captive renewable power share raised from about 26% to about 55% | Under implementation |
| Automation of post-winding operations | ₹40 crore | Auto-doffing and packing across yarn lines | Under implementation |
The most significant initiative is the Ecosis chemical recycling facility, which converts polyester textile waste back into virgin-equivalent polyester. The plant is targeted for commissioning in October 2026. Product development and trials with international customers, including Decathlon and American & Efird, are ongoing. The company has invested approximately ₹64.98 crore in Ecosis Limited as of the reporting date.
Dividend and Standalone Financials
The Board has recommended a final dividend of ₹0.30 per equity share of face value ₹1 each for the year ended March 31, 2026, subject to shareholder approval at the Annual General Meeting scheduled for September 22, 2026.
On a standalone basis, total revenue stood at ₹4,18,998 lakhs and net profit after tax at ₹18,390 lakhs for FY26, compared with ₹4,27,306 lakhs and ₹13,457 lakhs respectively in FY25. Basic and diluted earnings per share were ₹4.14 for FY26, up from ₹3.03 in FY25.
Foreign exchange earned during the year was ₹6,887.86 lakhs, while foreign exchange used was ₹1,18,003.31 lakhs. The company's CSR obligation for FY26 was ₹314.43 lakhs, against which total CSR expenditure of ₹693.28 lakhs was incurred, resulting in an excess spend of ₹378.85 lakhs available for set-off in subsequent years.
Credit Rating and Governance
India Ratings & Research (a Fitch Group company) reaffirmed the company's credit rating on May 12, 2026, assigning IND AA-/Stable for long-term bank facilities and IND A1+ for short-term facilities. The wholly owned subsidiary Ecosis Limited received a term loan rating of IND A+/Stable. The statutory audit for FY26 was conducted by M/s Arun K. Gupta & Associates, whose report contained no qualifications, reservations or adverse remarks.
Historical Stock Returns for Filatex India
| 1 Day | 5 Days | 1 Month | 6 Months | 1 Year | 5 Years |
|---|---|---|---|---|---|
| +7.57% | +31.93% | +30.89% | +167.26% | +94.70% | +115.29% |

How might the commissioning of the Ecosis chemical recycling facility in October 2026 impact Filatex India's revenue mix and margin profile given the current reliance on virgin polyester?
What are the potential risks to the company's deleveraging trend if the ₹335 crore debt-funded capital expenditure programme faces implementation delays or cost overruns?
How will the increased dependence on captive renewable energy (rising to 55%) affect Filatex India's operational costs compared to competitors relying on grid power in the medium term?
 18
18







 Create Custom Screeners
  Access 200+ Pre-built Filters
  Use 50+ Readymade Screener





