
 NewsFabtech Technologies wins Rs 152.3 crore work order from Pharma and Renewable Energy clients
Fabtech Technologies wins Rs 152.3 crore work order from Pharma and Renewable Energy clients


Fabtech Technologies secures Rs 152.3 crore confirmed work order in pharma and renewable energy sectors. Total disclosed order book reaches Rs 370.45 crore, offering ~6.76 quarters of revenue coverage. Execution trends remain positive with 45.3% YoY revenue growth in FY26. Low leverage (0.80x Liabilities/Equity) supports funding capacity.


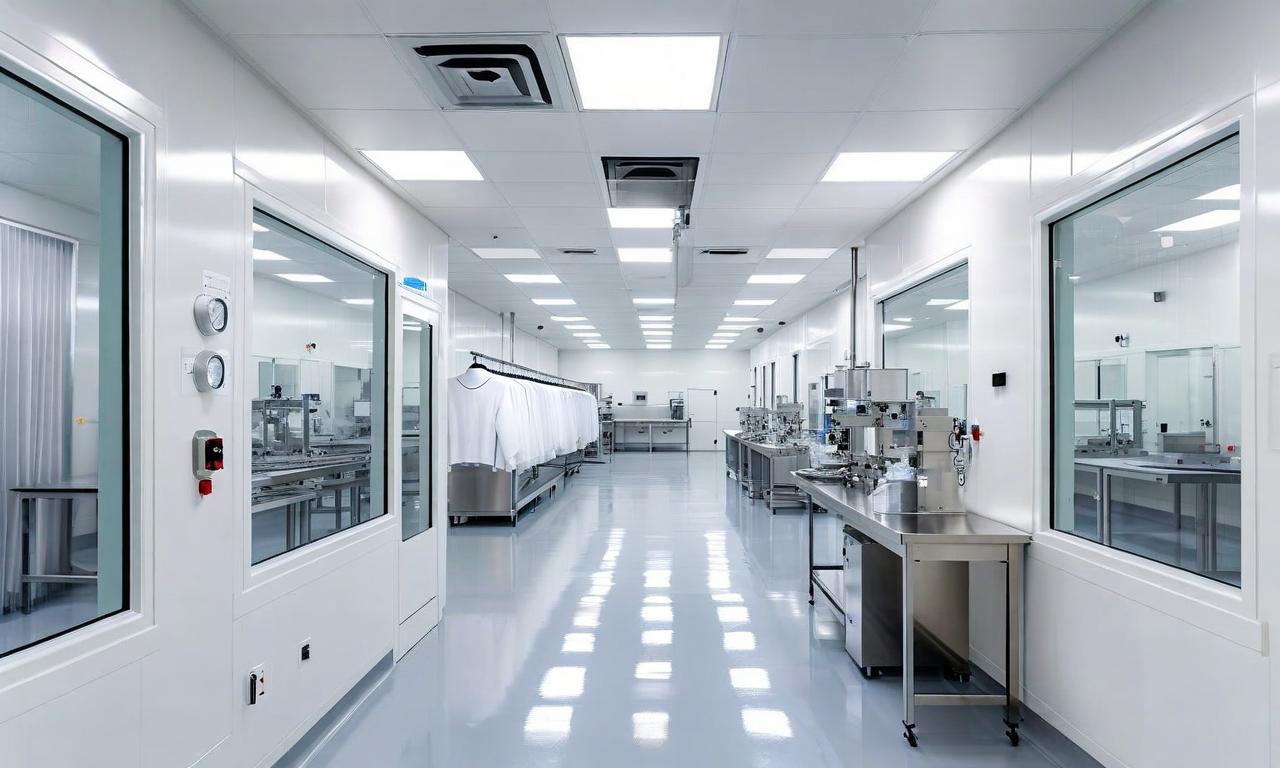
*this image is generated using AI for illustrative purposes only.
What Happened
Fabtech Technologies has secured a confirmed work order valued at Rs 152.3 crore. The contract comprises consolidated orders across three key sectors: pharma (Rs 88.42 crore), renewable energy (Rs 63.00 crore), and others (Rs 0.88 crore). Business verticals include cleanroom partitions (Rs 150.54 crore) and HVAC systems (heating, ventilation, and air conditioning systems) (Rs 1.76 crore). The filing was disclosed to the exchange on August 10, 2026.
Order In Financial Context
The Rs 152.3 crore order is approximately 277% of the company's average quarterly revenue of Rs 54.83 crore, highlighting the scale of this win relative to recent sales performance. The total disclosed order book now stands at Rs 370.45 crore (sum of the 3 orders disclosed across the last 3 fiscal quarters shown in the table below). This backlog represents approximately 6.76 quarters of coverage based on current revenue run-rates. The book-to-bill ratio remains elevated, signaling strong future revenue visibility as these contracts move into execution phases.
Company Order Track Record
Order inflow has been robust in recent quarters, with Q1FY27 seeing Rs 218.15 crore in wins. The current order value of Rs 152.3 crore is consistent with the company's typical per-order size visible in the history, particularly the Rs 153.05 crore order secured in June 2026. This consistency suggests stable demand patterns rather than sporadic large-ticket wins.
| Quarter: | Total Order Inflow (Rs Cr): | Key Awarding Entities: |
|---|---|---|
| Q1FY27 (Apr-Jun 2026) | 218.15 | One of the leading Company's in solar PV module manufacturing |
Execution And Revenue Quality
The company has demonstrated consistent profitability over the last three quarters. Revenue has grown steadily, supported by healthy operating profit margins. There are no signs of execution stress or margin erosion in the recent quarterly data.
Note: Quarterly consolidated P&L figures are not available in the provided input data. Annual data shows OPM of 9.79% in FY26.
Revenue Growth - Order Wins Translating To Revenue
As Fabtech technologies has sustained order wins, with significant inflows in Q1FY27, its annual revenue has grown from Rs 150.90 crore in FY25 to Rs 219.32 crore in FY26, representing a YoY growth of +45.3% based on the latest annual data. This historical trend confirms that past order bookings have effectively translated into top-line growth.
Working Capital And Execution Capacity
The company's balance sheet is well-positioned to handle the new order inflow. With a current ratio of 2.15x, Fabtech technologies has ample liquidity to manage working capital requirements. The Total Liabilities/Equity ratio stands at a conservative 0.80x, indicating low leverage and minimal financial risk. Operating cashflows have remained positive in recent years, supporting self-funded growth without excessive reliance on external debt.
What To Watch
- Execution rate: Monitor quarterly revenue run-rate vs total backlog to assess if the high order book converts into timely revenue recognition.
- OPM trajectory: Watch for margin quality on new pharma and renewable energy contracts compared to the historical average OPM of 9.79%.
- Client concentration: Assess what percentage of the disclosed order book comes from the top clients, particularly given the specific mention of solar PV module manufacturers in recent wins.
- Working capital cycle: Track receivables days and inventory turnover as the company scales up cleanroom partition installations.
Key Observations
- Backlog signal: Book-to-bill ratio is elevated with Rs 370.45 crore in backlog against Rs 219.32 crore annual revenue. At this level, execution capacity becomes the binding constraint.
- Valuation check (as of 10 Aug 2026): P/E of 27.4x against ROCE of 16.94%. At the time of this article, valuation was pricing in execution improvement not yet fully reflected in return ratios. (P/E is price-derived and will change; ROCE is from audited financials)
Historical Stock Returns for Fabtech Technologies
| 1 Day | 5 Days | 1 Month | 6 Months | 1 Year | 5 Years |
|---|---|---|---|---|---|
| -0.77% | -2.02% | +3.13% | +107.64% | +30.63% | +185.43% |

 19
19









 Access Market Heat-map & Insights
  Create, Save & Share your Screener
  Use 200+ Screening Filters





