

Devine Impex Q1 Results: Net profit falls 85% YoY to ₹1.15 crore


Devine Impex Limited posted a net profit of ₹1.15 crore for Q1FY26, down 85% YoY, while revenue rose 171% to ₹4.43 crore. Basic EPS fell to ₹0.45 from ₹2.03. The results were filed under SEBI LODR regulations on August 13, 2026.


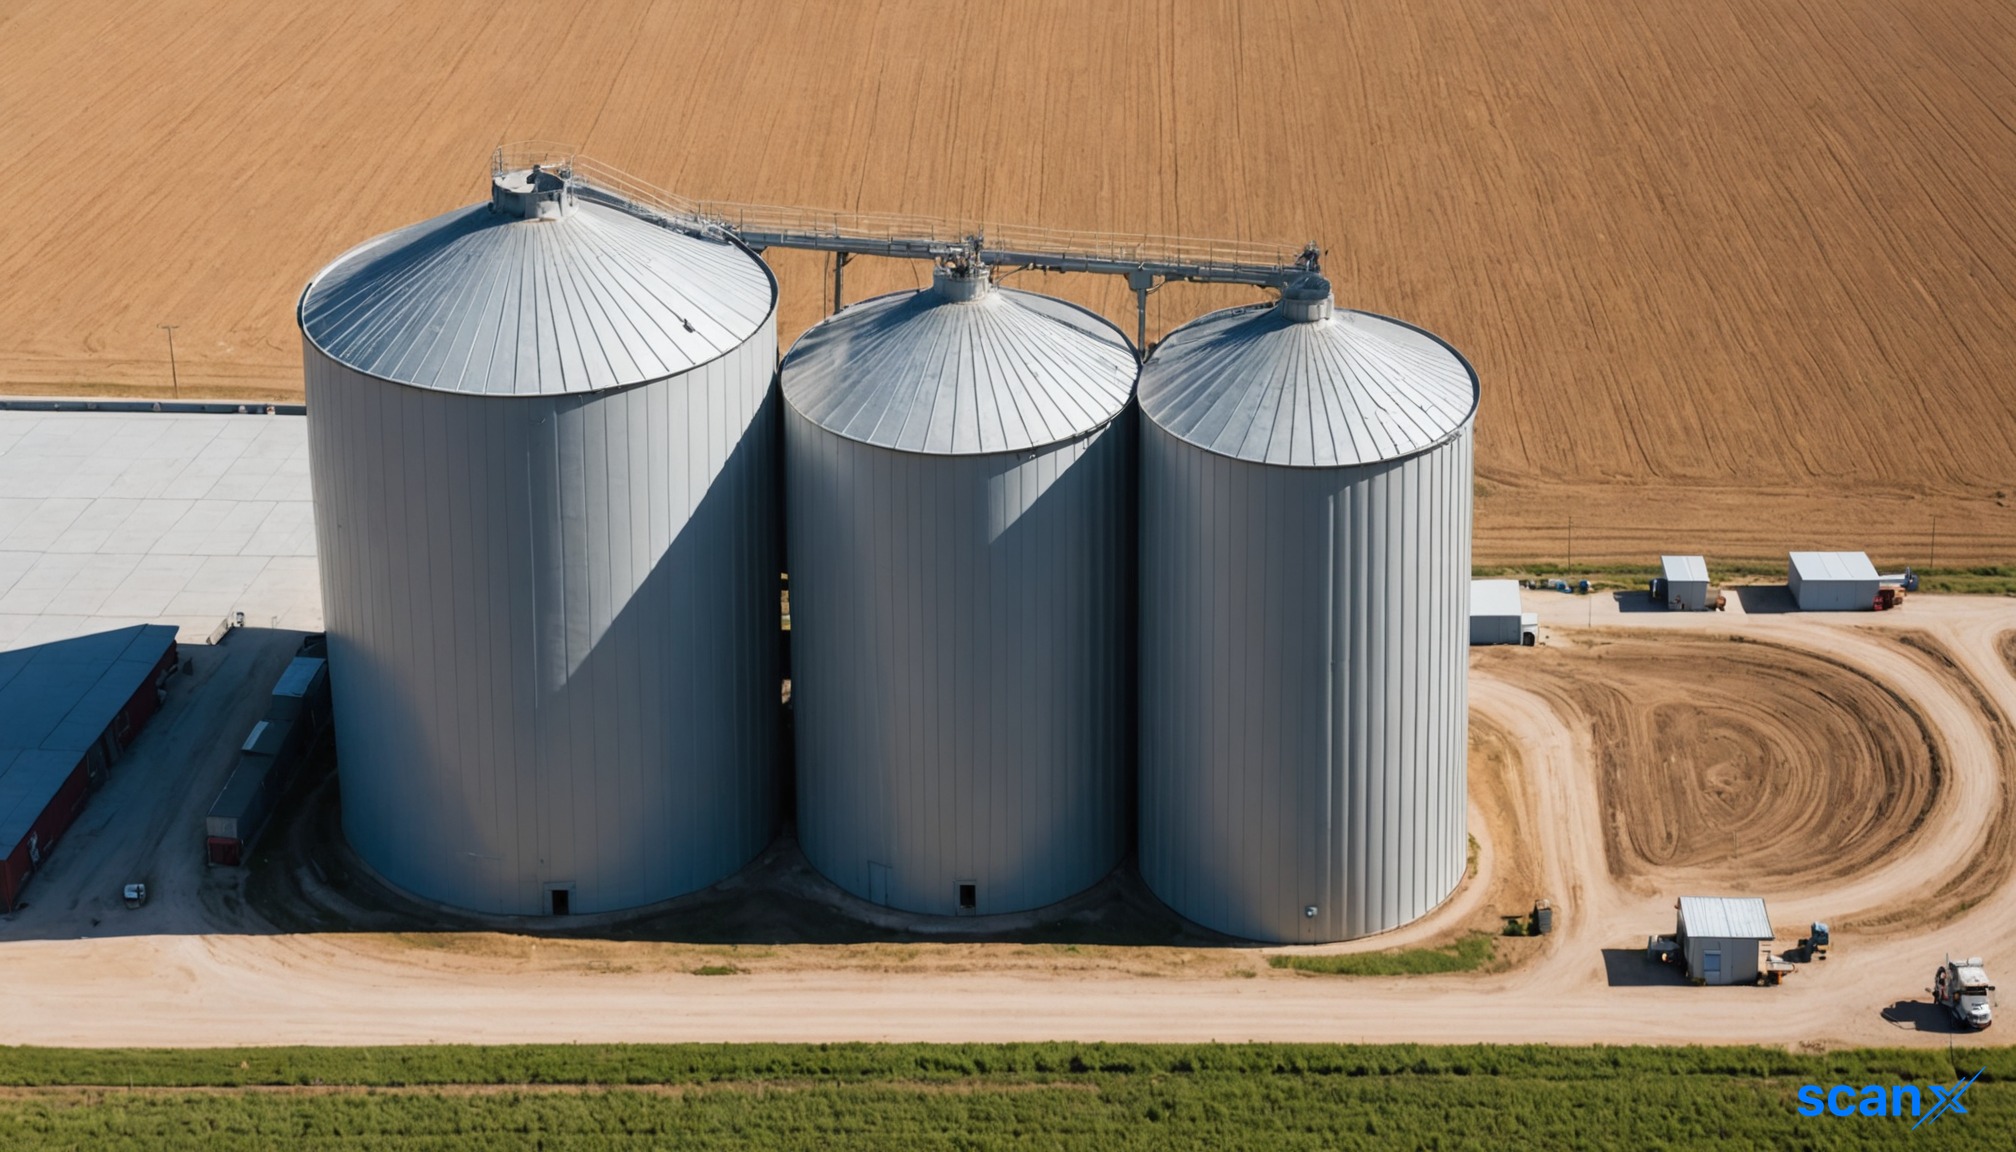
*this image is generated using AI for illustrative purposes only.
Devine Impex Limited reported a sharp contraction in profitability for the first quarter of FY26, with net profit falling 85% year-on-year despite a substantial rise in top-line revenue. The company disclosed unaudited financial results for the quarter ended June 30, 2026, showing a net profit of ₹1.15 crore (₹114.63 lakh), down from ₹7.80 crore (₹779.58 lakh) in the corresponding quarter of FY25.
Revenue from operations grew significantly, rising 171% to ₹4.43 crore (₹443.12 lakh) from ₹1.64 crore (₹163.61 lakh) in Q1FY25. This revenue surge was driven by higher operational activity, yet the disproportionate drop in net profit suggests increased costs or lower margins during the period.
Financial Highlights
The company’s basic earnings per share (EPS) declined to ₹0.45 per share, compared to ₹2.03 per share in the previous year’s quarter. Diluted EPS remained identical at ₹0.45. For the full fiscal year ended March 31, 2026, the company reported a net profit of ₹10.68 crore on revenue of ₹22.00 crore.
| Metric: | Q1FY26 (Unaudited): | Q1FY25 (Unaudited): | Change: |
|---|---|---|---|
| Revenue from Operations: | ₹4.43 crore | ₹1.64 crore | +171% |
| Net Profit (Pre-tax): | ₹1.15 crore | ₹7.80 crore | -85% |
| Net Profit (Post-tax): | ₹1.15 crore | ₹7.80 crore | -85% |
| Basic EPS: | ₹0.45 | ₹2.03 | -78% |
What the Numbers Show
The divergence between revenue growth and profit decline is the key takeaway from this quarter. While revenue more than doubled, net profit collapsed to roughly one-seventh of its prior-year level. This indicates that the additional revenue generated did not translate into proportional earnings, pointing to a severe compression in operating margins or a spike in operational expenses during the quarter.
Regulatory Disclosure
The financial results were published in The Pioneer (English) and Desh Pardesh (Punjabi) on August 13, 2026, pursuant to Regulation 30 read with Regulation 47 of the SEBI (Listing Obligations and Disclosure Requirements) Regulations, 2015. The disclosure was signed by Neeraj Jain, Managing Director of Devine Impex Limited.
Historical Stock Returns for Devine Impex
| 1 Day | 5 Days | 1 Month | 6 Months | 1 Year | 5 Years |
|---|---|---|---|---|---|
| 0.0% | -0.49% | -1.10% | +4.00% | +1.77% | +66.19% |

What specific operational expenses or cost drivers caused the severe margin compression despite the 171% revenue surge?
Will Devine Impex implement pricing adjustments or cost-cutting measures in Q2FY26 to restore profitability levels?
How does this sharp profit decline impact investor confidence and potential short-term volatility in the company's stock price?
 15
15






 Access 50+ Readymade Screeners
  Use 200+ Custom Filters
  Get Full Market Insights





