

Devine Impex net profit turns positive at ₹3.93 crore in Q1FY27


Devine Impex Limited has returned to profitability in Q1FY27 with a net profit of ₹3.93 crore, up from a loss of ₹1.13 crore in Q1FY26. Revenue from operations grew 117% YoY to ₹26.45 crore, while total expenses were controlled at ₹23.71 crore. The turnaround follows a significant loss of ₹8.89 crore in Q4FY26, highlighting seasonal volatility but improved operational efficiency in the current quarter.


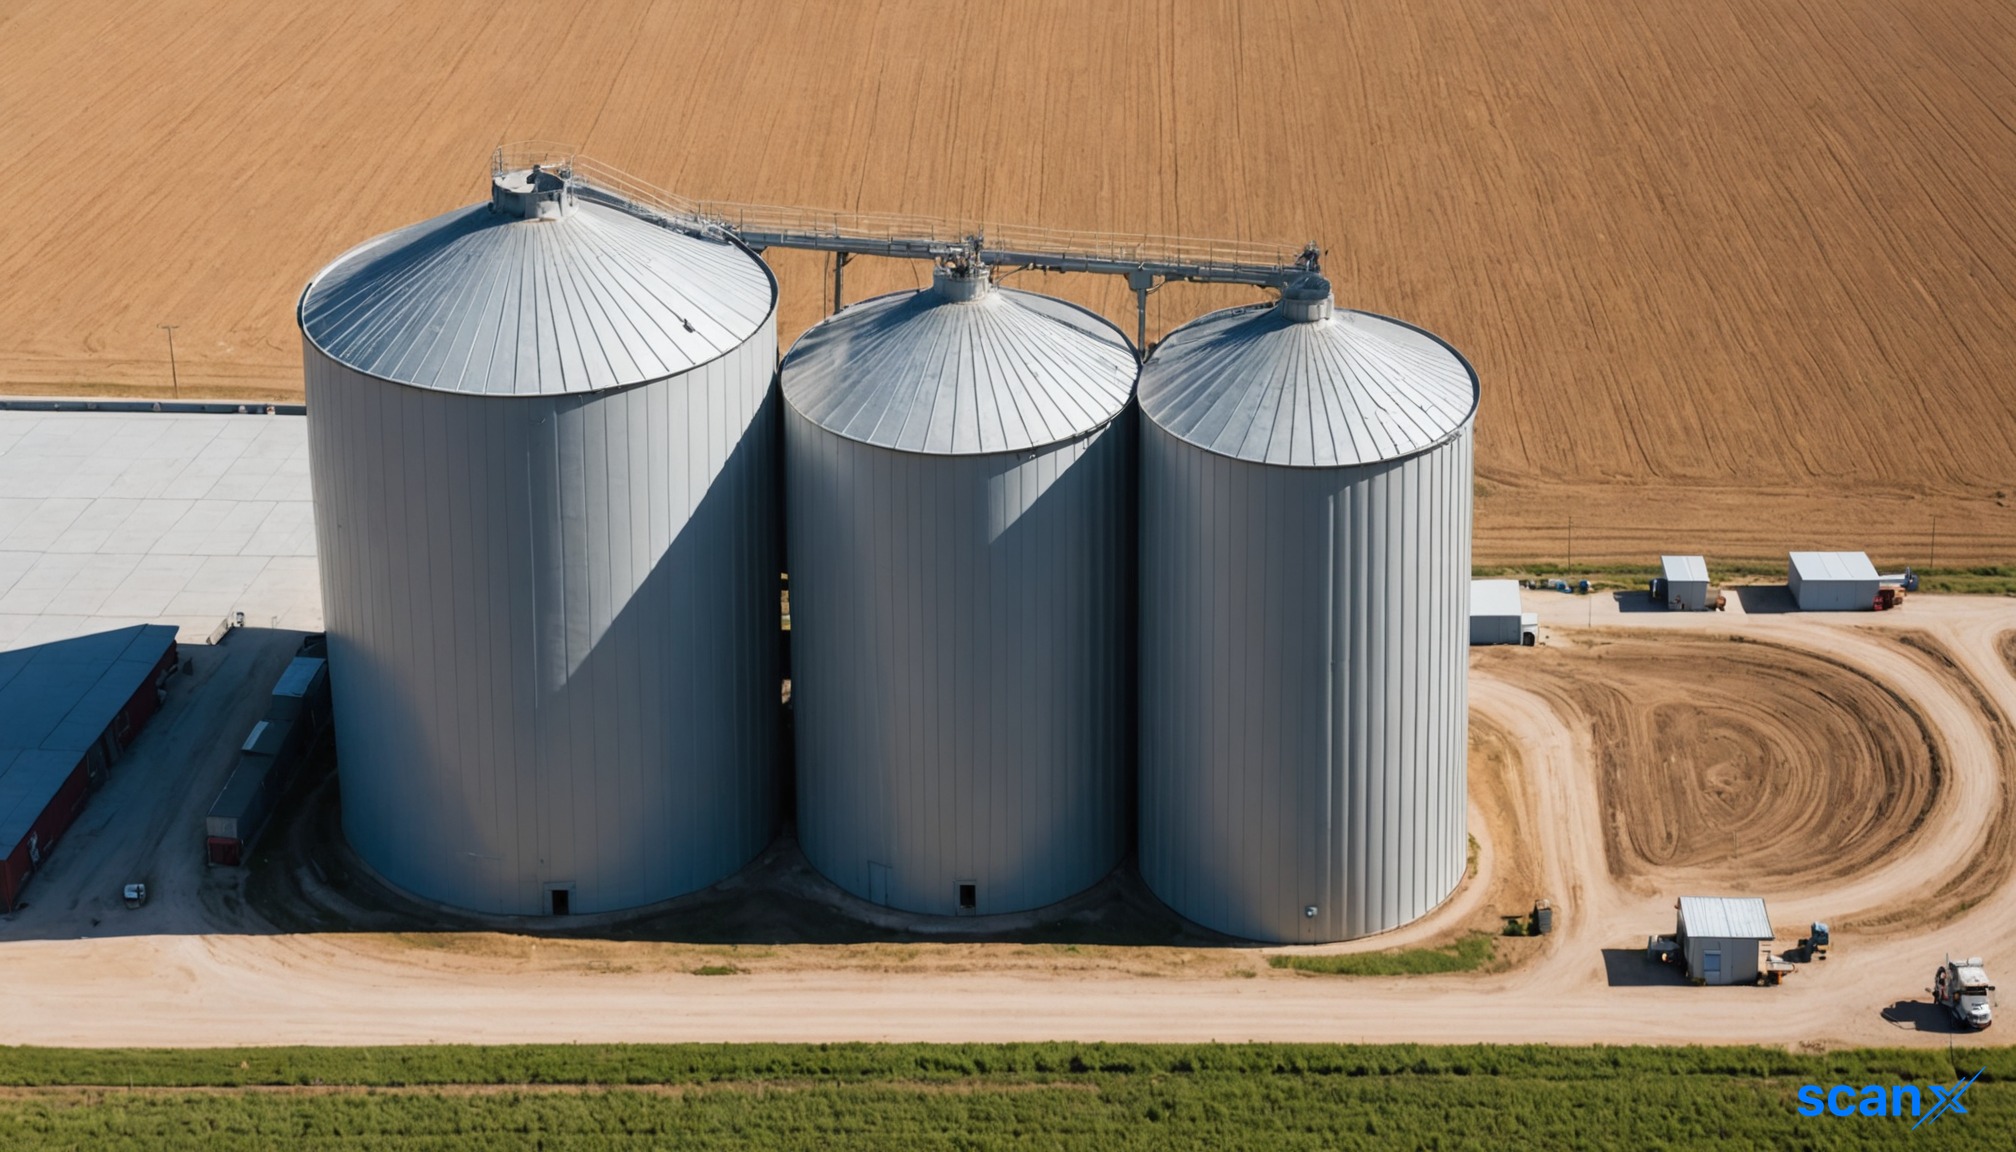
*this image is generated using AI for illustrative purposes only.
Devine Impex Limited has reported a net profit of ₹3.93 crore for the quarter ended June 30, 2026 (Q1FY27), marking a significant turnaround from the net loss of ₹1.13 crore recorded in the corresponding period of FY26. This positive result signals an operational recovery for the Mohali-based company, which also saw its revenue from operations surge 117% year-on-year to ₹26.45 crore, up from ₹12.19 crore in Q1FY26. The profitability shift is particularly notable given the substantial loss of ₹8.89 crore reported in the preceding quarter (Q4FY26).
The Board of Directors approved the unaudited financial results on August 12, 2026, pursuant to Regulation 30 and Regulation 33 of the Securities and Exchange Board of India (Listing Obligations and Disclosure Requirements) Regulations, 2015. The results were reviewed by the Audit Committee and subjected to a limited review by the statutory auditors, Deepak Jindal & Co. Chartered Accountants (FRN: 023023N). The review was conducted in accordance with Standard on Review Engagements (SRE) 2410 issued by the Institute of Chartered Accountants of India.
Financial Performance Overview
Devine Impex Limited generated total income from operations of ₹28.81 crore in Q1FY27, compared to ₹12.19 crore in Q1FY26. This increase was primarily driven by higher revenue from operations, supplemented by other income of ₹2.36 crore. In contrast, the previous quarter (Q4FY26) saw total income of ₹75.09 crore, indicating seasonal variations or specific large-ticket transactions in the prior period.
| Particulars | Q1FY27 (₹ crore) | Q4FY26 (₹ crore) | Q1FY26 (₹ crore) | YoY Change |
|---|---|---|---|---|
| Revenue from Operations | 26.45 | 75.09 | 12.19 | +117% |
| Other Income | 2.36 | - | - | New |
| Total Income | 28.81 | 75.09 | 12.19 | +137% |
| Total Expenses | 23.71 | 87.28 | 13.32 | +78% |
| Profit Before Tax | 5.10 | (12.19) | (1.13) | Turnaround |
| Net Profit/(Loss) | 3.93 | (8.89) | (1.13) | Turnaround |
Expenses stood at ₹23.71 crore in Q1FY27, up from ₹13.32 crore in Q1FY26 but significantly lower than the ₹87.28 crore incurred in Q4FY26. The cost structure was dominated by purchases of stock-in-trade (₹7.83 crore) and changes in inventories of stock-in-trade (₹12.25 crore). Employee benefits expense remained flat at ₹1.07 crore quarter-on-quarter and year-on-year. Finance costs were negligible at ₹0.00 crore.
What the Numbers Show
The most notable aspect of Devine Impex’s Q1FY27 performance is the volatility between quarters. While the company returned to profitability compared to the same period last year, it still trails the revenue scale of Q4FY26, where revenue was nearly three times higher. However, the expense management in Q1FY27 appears more aligned with current revenue levels than in Q4FY26, where expenses exceeded income by a wide margin, leading to a substantial loss. The positive earnings per share (EPS) of ₹0.04 in Q1FY27 contrasts with the negative EPS of ₹(0.09) in Q4FY26 and ₹(0.01) in Q1FY26, reflecting improved bottom-line efficiency despite moderate top-line growth relative to the peak quarter.
The statutory auditors, Deepak Jindal & Co., confirmed that the unaudited financial results have been prepared in accordance with Indian Accounting Standard 34 (Ind AS 34) and other generally accepted accounting principles. The company operates in a single segment, and no separate segment results were disclosed. Previous period figures have been regrouped where necessary to ensure comparability.
Historical Stock Returns for Devine Impex
| 1 Day | 5 Days | 1 Month | 6 Months | 1 Year | 5 Years |
|---|---|---|---|---|---|
| 0.0% | -0.49% | -1.10% | +4.00% | +1.77% | +66.19% |

What specific operational strategies or market factors drove the 117% year-on-year revenue surge, and are these growth drivers sustainable for Q2FY27?
How does management plan to address the significant quarterly volatility, particularly the sharp decline in revenue from ₹75.09 crore in Q4FY26 to ₹26.45 crore in Q1FY27?
With inventory changes accounting for a major portion of expenses, what is the current inventory turnover ratio and are there risks of stock obsolescence or write-downs in upcoming quarters?
 20
20






 Create Custom Screeners
  Access 200+ Pre-built Filters
  Use 50+ Readymade Screener





