

Ddev Plastiks Industries submits FY26 BRSR report to exchanges


- Ddev Plastiks Industries submitted its FY26 BRSR report to exchanges on August 31, 2026
- Total energy consumption rose to 2,55,849.67 GJ, with renewable share declining to 5,251.28 GJ
- Scope 1 greenhouse gas emissions surged to 838.91 MT CO2e from 107.39 MT CO2e in FY25
- Total waste generated increased to 2,141.09 metric tonnes, driven by hazardous waste rise
- All 31 stakeholder complaints received during FY26 were resolved within the year

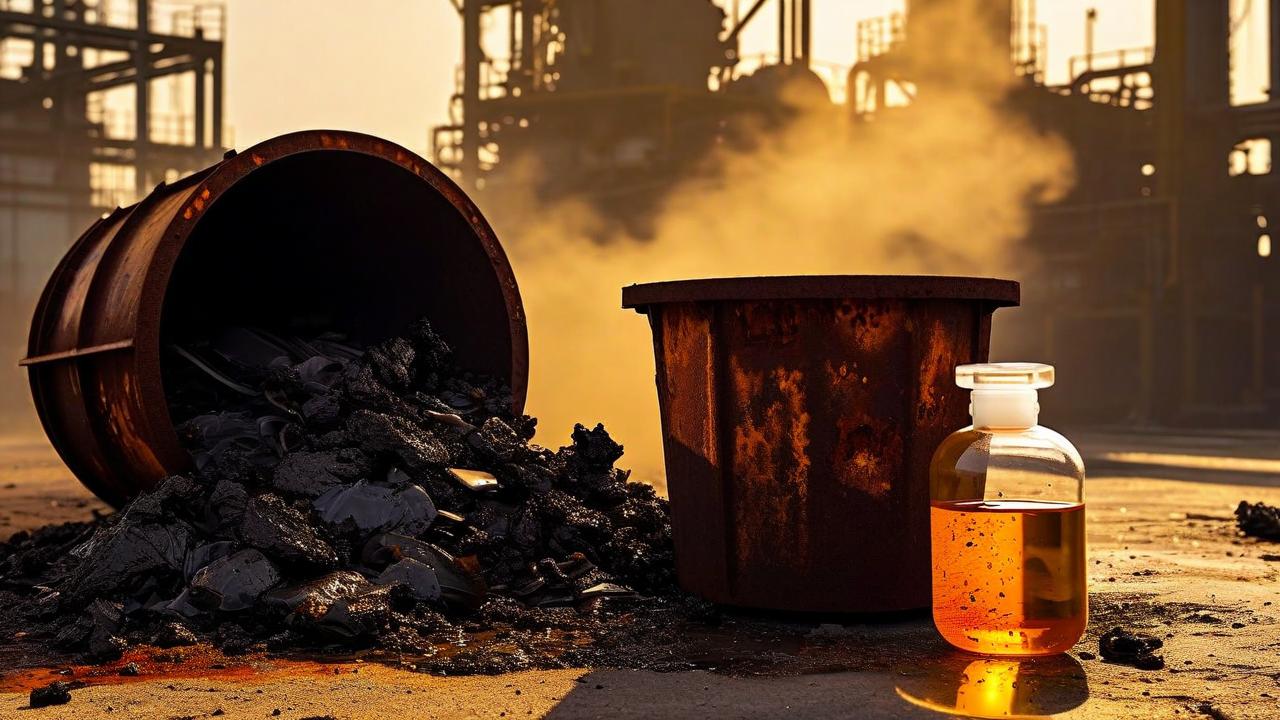

*this image is generated using AI for illustrative purposes only.
Ddev Plastiks Industries submitted its Business Responsibility and Sustainability Report (BRSR) for FY26 to the stock exchanges on August 31, 2026. The filing discloses environmental metrics, waste management data, and stakeholder engagement details.
The report, signed by Company Secretary Tanvi Goenka, forms part of the company's annual report for the financial year ended March 31, 2026. It is available on the company's website under the financial reporting section.
Environmental Metrics
Ddev Plastiks reported a total energy consumption of 2,55,849.67 GJ for FY26. This represents an increase from 2,24,325.60 GJ in FY25. Renewable energy consumption fell to 5,251.28 GJ from 6,136.17 GJ in the prior year. Non-renewable energy consumption rose significantly to 2,50,598.39 GJ from 2,18,189.43 GJ.
| Metric | FY26 | FY25 |
|---|---|---|
| Total Energy Consumption (GJ) | 2,55,849.67 | 2,24,325.60 |
| Renewable Energy (GJ) | 5,251.28 | 6,136.17 |
| Non-Renewable Energy (GJ) | 2,50,598.39 | 2,18,189.43 |
Greenhouse gas emissions showed a notable shift in composition. Scope 1 emissions rose sharply to 838.91 MT CO2e from 107.39 MT CO2e. Scope 2 emissions increased to 48,731.90 MT CO2e from 43,759.85 MT CO2e. The combined emission intensity per rupee of turnover remained stable at 1.68 MT/Million INR, compared to 1.69 MT/Million INR in FY25.
Waste and Water Management
Total waste generated increased to 2,141.09 metric tonnes from 1,362.92 metric tonnes in FY25. Plastic waste declined slightly to 1,177.54 metric tonnes from 1,324.71 metric tonnes. However, other hazardous waste surged to 957.78 metric tonnes from 38.21 metric tonnes. The company recycled 1,178.62 metric tonnes of waste in FY26.
Water withdrawal rose to 1,00,978.5 kilolitres from 94,203 kilolitres. Total water consumption decreased to 89,024.5 kilolitres from 91,623 kilolitres. Water intensity per rupee of turnover improved to 3.02 KL/Millions INR from 3.52 KL/Millions INR.
Stakeholder Engagement
The company received 31 complaints during FY26, comprising 25 from customers and 6 from shareholders. All complaints were resolved by the end of the year. No complaints were filed by employees, workers, or communities. The company maintains zero tolerance for sexual harassment and discrimination, with no such complaints recorded in FY26 or FY25.
What the Numbers Show
While total energy consumption rose by nearly 14%, renewable energy usage dropped by approximately 14%. This divergence suggests a higher reliance on non-renewable sources despite the installation of a 1.7 MW rooftop solar system at the Surangi plant. Additionally, while plastic waste generation decreased, the sharp rise in other hazardous waste indicates shifting operational outputs or reporting categorizations.
Historical Stock Returns for Ddev Plastiks Industries
| 1 Day | 5 Days | 1 Month | 6 Months | 1 Year | 5 Years |
|---|---|---|---|---|---|
| +0.44% | +7.05% | +4.27% | +9.64% | -15.77% | +0.54% |

How does Ddev Plastiks plan to reverse the decline in renewable energy usage despite the recent installation of a 1.7 MW rooftop solar system?
What specific operational changes or new product lines contributed to the sharp surge in hazardous waste generation from 38.21 to 957.78 metric tonnes?
Given the significant rise in Scope 1 emissions, what capital expenditures is the company planning to mitigate direct greenhouse gas impacts in FY27?
 15
15






 Access Market Heat-map & Insights
  Create, Save & Share your Screener
  Use 200+ Screening Filters





