

Century Enka Reports FY26 Net Profit of ₹10,169 Lacs; 60th AGM Scheduled for August 20


Century Enka Limited reported strong FY 2025–26 results with standalone net profit rising to ₹10,169 lacs and EBIDTA growing 25% to ₹190 crore, despite a revenue decline to ₹1,70,541 lacs. The company maintained 24–25% domestic market share in NFY and NTCF, achieved 57% renewable energy share, and recommended a dividend of ₹11 per share. The 60th AGM is scheduled for 20th August 2026.


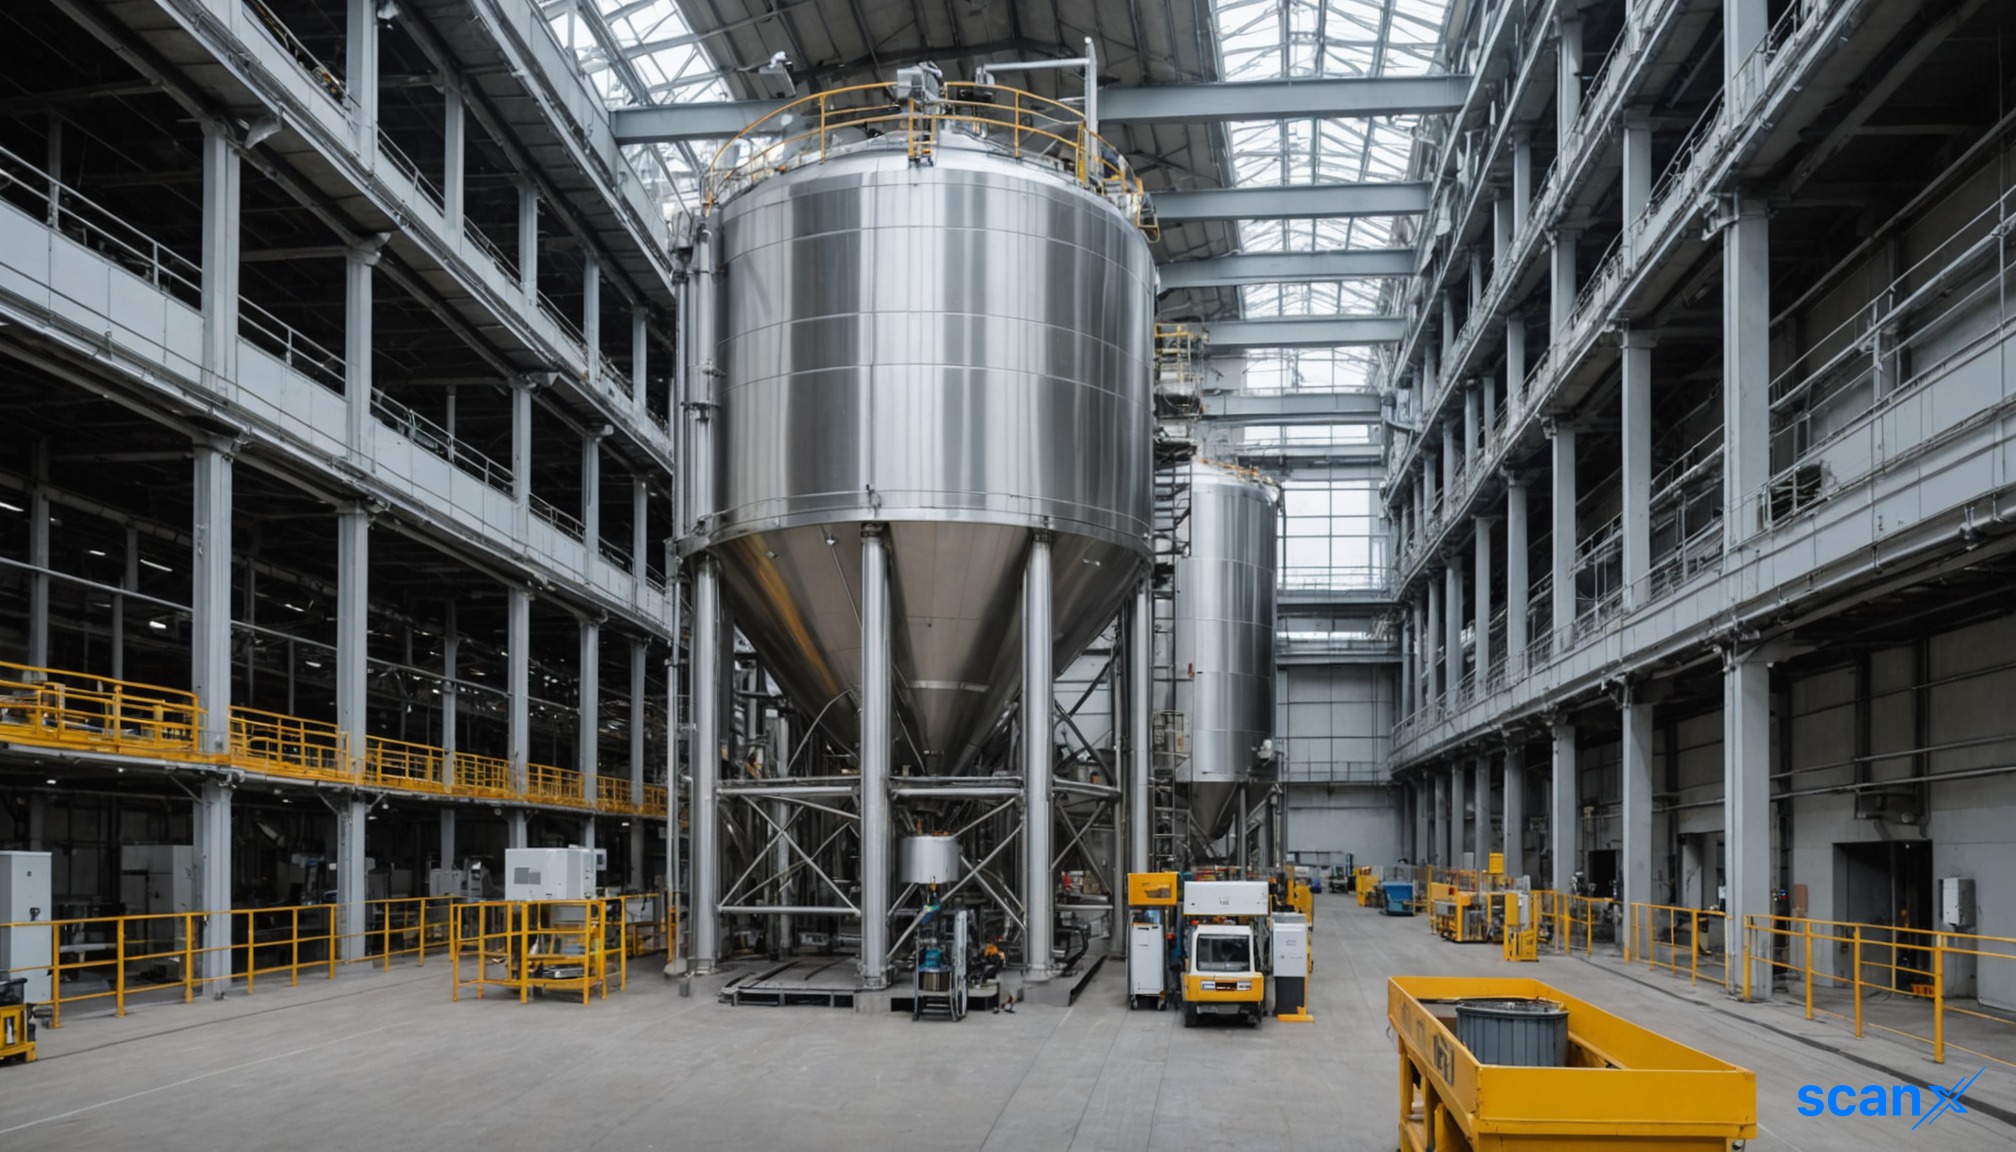
*this image is generated using AI for illustrative purposes only.
Century Enka Limited has submitted its Notice of the 60th Annual General Meeting (AGM) and Integrated Annual Report for FY 2025–26 to the stock exchanges, disclosing a strong improvement in full-year financial performance. On a standalone basis, the company reported net profit after tax of ₹10,169 lacs for the financial year ended 31st March 2026, compared to ₹6,710 lacs in the previous year. Net revenue from operations declined to ₹1,70,541 lacs from ₹2,00,169 lacs, primarily due to lower sales volumes and reduced raw material prices. Profit before depreciation, finance cost, exceptional items and tax rose to ₹18,969 lacs from ₹15,208 lacs, reflecting approximately 25% growth. The Board has recommended a dividend of ₹11 per equity share (110%), up from ₹10 per share (100%) in the previous year, with the dividend payment date set on or after Monday, 24th August 2026.
Full-Year Financial Performance
The company's financial results for FY 2025–26 reflect significant profitability improvement despite a revenue contraction. The following table summarises the key standalone and consolidated financial highlights:
| Metric: | FY 2025–26 (₹ Lacs) | FY 2024–25 (₹ Lacs) |
|---|---|---|
| Net Revenue from Operations (Standalone): | 1,70,541 | 2,00,169 |
| PBIDT (Standalone): | 18,969 | 15,208 |
| Net Profit – Standalone: | 10,169 | 6,710 |
| Net Profit – Consolidated: | 10,084 | 6,647 |
| Basic EPS – Standalone (₹): | 46.54 | 30.71 |
| Basic EPS – Consolidated (₹): | 46.15 | 30.42 |
| Dividend per Share (₹): | 11.00 | 10.00 |
On a consolidated basis, net profit stood at ₹10,084 lacs against ₹6,647 lacs in the previous year. The decline in revenue was attributed to lower volumes and realization in both Nylon Tyre Cord Fabric (NTCF) and Nylon Filament Yarn (NFY) segments, linked to lower raw material prices. An exceptional item of ₹186 lacs was recognized as the statutory impact of the new Labour Codes, classified as past service cost under gratuity. The company's Earnings Before Interest, Depreciation and Tax (EBIDTA) increased by 25% to ₹190 crore in FY 2025–26 from ₹152 crore in the previous year.
Segmental and Operational Highlights
Century Enka maintained its market leadership with a 24% domestic market share in Nylon Filament Yarn (NFY) and 25% in Nylon Tyre Cord Fabric (NTCF). Total installed production capacity stood at 92,000 MT, with total output of 72,508 MT during the reporting period. The company's product portfolio is balanced between Reinforcement Fabric (revenue share of ₹815.36 Crs) and Synthetic Yarn (revenue share of ₹827.84 Crs). During the year, the company initiated steps to increase capacity of Draw Texturizing Yarn (DTY) and Mother Yarn, and continued focus on product customization and value-added products. The company also invested in ABREL Century Energy Limited to obtain power from the second phase of its Hybrid (Solar and Wind) Power Project.
| Segment: | FY 2025–26 Revenue | FY 2024–25 Revenue |
|---|---|---|
| Reinforcement Fabric (₹ Lacs): | 81,536 | 96,088 |
| Yarn (₹ Lacs): | 82,784 | 93,677 |
| Others (₹ Lacs): | 3,758 | 6,437 |
Balance Sheet and Key Ratios
The company's balance sheet strengthened considerably during the year. Total equity on a standalone basis rose to ₹1,50,059 lacs from ₹1,42,144 lacs. Total borrowings reduced to ₹1,990 lacs from ₹3,390 lacs, resulting in a debt-to-equity ratio of 0.01. Capital expenditure during the year amounted to ₹37.02 Crs, directed towards modernisation, technology upgrades, energy conservation, and infrastructure development. Foreign exchange used during the year was ₹33,609 lacs (previous year ₹79,982 lacs) and earned was ₹7,296 lacs (previous year ₹8,281 lacs).
| Key Ratio: | FY 2025–26 | FY 2024–25 |
|---|---|---|
| Debt Equity Ratio: | 0.01 | 0.02 |
| Interest Coverage Ratio: | 65.03 | 33.50 |
| Net Profit Margin: | 6% | 3.35% |
| Return on Capital Employed: | 8.50% | 6.38% |
| Debtors Turnover Ratio: | 9.15 | 10.70 |
| Inventory Turnover Ratio: | 6.42 | 7.45 |
Sustainability and ESG Performance
Century Enka achieved a 57% share of renewable energy in total energy consumption during FY 2025–26, with total energy consumption of 15,20,584.34 GJ. The company recorded a 13.37% reduction in carbon intensity (tCO2e/MT) compared to the previous year. Total Scope 1 emissions stood at 15,481.32 tCO2e and Scope 2 emissions at 90,040.16 tCO2e. Total water consumption across both facilities was 6,46,601 kiloliters, with both plants achieving Zero Liquid Discharge (ZLD) status. CSR expenditure for the year was ₹179.42 lacs, benefiting approximately 48,669 individuals across education, healthcare, rural infrastructure, and women empowerment initiatives.
60th AGM and Corporate Governance
The 60th AGM of Century Enka Limited is scheduled for Thursday, 20th August 2026, at 2:30 PM (IST), to be held through Video Conferencing. Key agenda items include adoption of audited financial statements, declaration of dividend, appointment of M/s. Singhi & Co. as new Statutory Auditors for a term of five years, re-appointment of Mrs. Rajashree Birla as Non-Executive Director (liable to retire by rotation), and re-appointment of Mr. Suresh Sodani as Managing Director and CEO for a further period of two years from 1st April 2027 to 31st March 2029. The Board comprises six directors, with Independent Directors representing 50% of total Board strength. The company's credit ratings were reaffirmed at CRISIL A+/Stable for long-term and CRISIL A1+ for short-term bank facilities.
Source: https://lodr-files.dhan.co/lodr-inputs/Company/INE485A01015/263de5b8-e50d-4820-b374-55796f538441.pdf
Historical Stock Returns for Century Enka
| 1 Day | 5 Days | 1 Month | 6 Months | 1 Year | 5 Years |
|---|---|---|---|---|---|
| +2.32% | +5.48% | +2.00% | +39.17% | +14.80% | +29.86% |

How might the ongoing decline in raw material prices impact Century Enka's revenue realization and volume trends in the upcoming fiscal year?
What is the expected timeline and financial impact of the capacity expansion initiatives for Draw Texturizing Yarn (DTY) and Mother Yarn?
How will the investment in ABREL Century Energy Limited affect the company's long-term energy cost structure and sustainability metrics?
 17
17






 Create Custom Screeners
  Access 200+ Pre-built Filters
  Use 50+ Readymade Screener





