
 NewsCentury Communities Reports Q2 2026 Results: EPS Beats Estimates, Record Community Count of 330
Century Communities Reports Q2 2026 Results: EPS Beats Estimates, Record Community Count of 330


Century Communities reported Q2 2026 adjusted EPS of $1.30, beating the $0.60 analyst estimate, with total revenues of $927.2 million exceeding estimates by 8.17%. The company delivered 2,506 homes, achieved a record 330 open communities, and raised full-year 2026 home delivery guidance to 9,750–10,500 homes with home sales revenues expected between $3.5 billion and $3.8 billion.


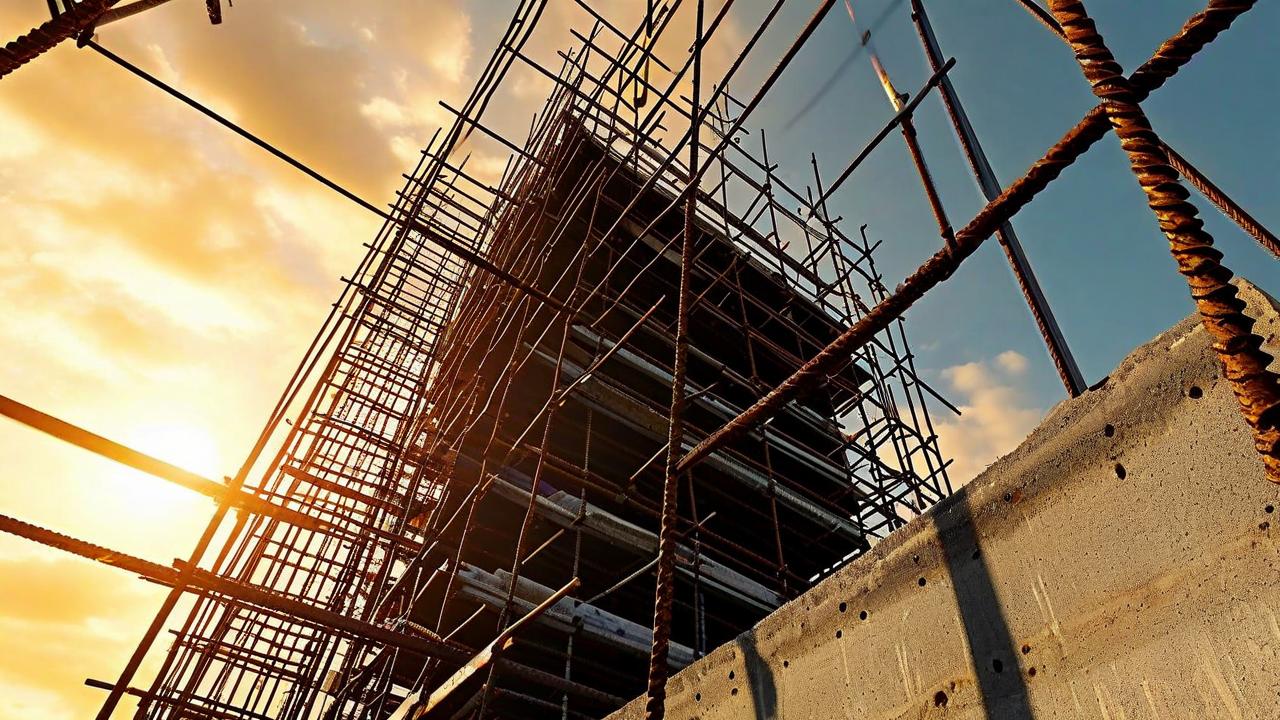
*this image is generated using AI for illustrative purposes only.
Century Communities, Inc., one of the nation's largest homebuilders, reported its second quarter 2026 financial results on July 22, 2026, delivering adjusted earnings per share of $1.30, significantly surpassing the analyst consensus estimate of $0.60. Net income for the quarter was $36.1 million, or $1.26 per diluted share, representing an 11% year-over-year increase on a per diluted share basis. The company ended the quarter with a record 330 open communities, reflecting continued investment in growth despite macro headwinds and weak consumer sentiment.
Second Quarter 2026 Financial Highlights
The following table summarizes key financial metrics for Q2 2026 compared to Q2 2025 and analyst estimates:
| Metric: | Q2 2026 | Q2 2025 | Analyst Estimate | % Change vs Estimate | % Change vs Prior Year |
|---|---|---|---|---|---|
| Adjusted EPS ($): | 1.30 | 1.44 | 0.60 | +116.67% | -9.72% |
| GAAP Diluted EPS ($): | 1.26 | 1.14 | — | — | +10.53% |
| Total Revenues ($ million): | 927.227 | 1,000.724 | 857.226 | +8.17% | -7.35% |
| Home Sales Revenues ($ million): | 897.528 | 976.467 | — | — | -8.09% |
| Net Income ($ million): | 36.148 | 34.854 | — | — | +3.71% |
Total revenues of $927.2 million beat the analyst consensus estimate of $857.226 million by 8.17%, though they declined compared to $1,000.724 million in the prior year period. Home sales revenues totaled $897.5 million, with 2,506 homes delivered at a weighted average sales price of $358,200. Financial services revenues and pre-tax income were $25.4 million and $9.9 million, respectively.
Operational Performance
Net new home contracts in Q2 2026 totaled 2,615, a 2.7% increase year-over-year. The company ended the quarter with 1,264 homes in backlog, representing a backlog dollar value of $469.3 million. Deliveries of 2,506 homes grew 25% sequentially, exceeding guidance on stronger order activity. Traffic posted a sequential gain of 9% in the quarter.
The following table presents new home deliveries by segment for Q2 2026 versus Q2 2025:
| Segment: | Q2 2026 Homes | Q2 2025 Homes | Avg. Sales Price Q2 2026 ($K) | Avg. Sales Price Q2 2025 ($K) | % Change (Homes) |
|---|---|---|---|---|---|
| West: | 322 | 335 | 568.9 | 602.5 | -3.9% |
| Mountain: | 416 | 396 | 476.5 | 521.0 | +5.1% |
| Texas: | 527 | 501 | 290.8 | 294.2 | +5.2% |
| Southeast: | 362 | 401 | 383.2 | 429.9 | -9.7% |
| Century Complete: | 879 | 954 | 255.1 | 260.5 | -7.9% |
| Total / Wtd. Avg.: | 2,506 | 2,587 | 358.2 | 377.5 | -3.1% |
Homebuilding gross margin was 18.1% for the quarter. Adjusted homebuilding gross margin, excluding interest and purchase price accounting, was 20.0%, an improvement of 30 basis points sequentially, benefiting from lower incentives and direct costs. Selling, general, and administrative expenses as a percentage of home sales revenues was 14.2%. Adjusted EBITDA and EBITDA for Q2 2026 were $78.2 million and $71.0 million, respectively.
Balance Sheet and Liquidity
The company maintained a strong financial position at the end of Q2 2026. The following table outlines key balance sheet metrics:
| Metric: | June 30, 2026 | December 31, 2025 |
|---|---|---|
| Total Assets ($K): | 4,691,271 | 4,459,895 |
| Total Liabilities ($K): | 2,125,520 | 1,868,163 |
| Total Stockholders' Equity ($K): | 2,565,751 | 2,591,732 |
| Cash & Equivalents ($K): | 92,334 | 109,443 |
| Cash Held in Escrow ($K): | 39,709 | 48,571 |
| Total Liquidity ($M): | 802.4 | — |
| Book Value Per Share ($): | 90.24 | — |
| Homebuilding Debt to Capital: | 34.2% | 29.1% |
| Net Homebuilding Debt to Net Capital: | 31.9% | 25.9% |
Book value per share reached $90.24, a company record, as of June 30, 2026. Total liquidity stood at $802.4 million, including $132.0 million of cash (including cash equivalents and cash held in escrow). Stockholders' equity totaled $2.6 billion. During the quarter, the company repurchased 352,811 shares of common stock for $19.6 million at a 38% discount to book value per share, while maintaining its quarterly cash dividend of $0.32 per share.
Management Commentary
Dale Francescon, Executive Chairman, stated: "We delivered strong second quarter results despite continued headwinds from macro challenges and weak consumer sentiment, with earnings per diluted share of $1.26 increasing by 11% on a year-over-year basis and 50% sequentially. We continued to invest in our business and ended the quarter with 330 open communities, a Company record. Our balance sheet remains strong with $2.6 billion of stockholders' equity and $802 million of liquidity, and we repurchased 352,811 shares of our common stock for $19.6 million at a 38% discount to our Company record book value per share of $90.24 while maintaining our quarterly cash dividend of $0.32 per share and continuing to position Century for future growth."
Rob Francescon, Chief Executive Officer and President, added: "Our deliveries of 2,506 homes grew by 25% on a sequential basis and exceeded our guidance on stronger order activity, with our net orders of 2,615 homes increasing by 3% on a year-over-year basis and 10% sequentially. Our net orders were relatively stable throughout the quarter, with our traffic posting a sequential gain of 9% in the second quarter. Our adjusted homebuilding gross margin of 20.0% increased by 30 basis points on a sequential basis, benefitting from lower incentives and direct costs as we controlled our costs and inventory levels."
Full Year 2026 Outlook
Scott Dixon, Chief Financial Officer, commented: "We are raising the midpoint and low end of our full year 2026 home delivery guidance to be in the range of 9,750 to 10,500 homes, with our home sales revenues expected to be in the range of $3.5 billion to $3.8 billion."

How will the company maintain margin expansion if macro headwinds persist and consumer sentiment remains weak?
What impact will the rising Homebuilding Debt to Capital ratio have on future capital allocation and share repurchase programs?
Can the record 330 open communities be sustained given the current backlog of only 1,264 homes?
 16
16





 Create Custom Screeners
  Access 200+ Pre-built Filters
  Use 50+ Readymade Screener





