

BCE Q2FY26 Results: Revenue up 1.5%, FCF exceeds $1 billion


- Consolidated revenue rose 1.5% YoY; adjusted EBITDA grew 1% to stable 43.8% margin
- Free cash flow exceeded $1 billion despite $317 million capex increase for AI and fiber
- Net debt leverage improved to 3.7x, supported by $2.5 billion debt offerings
- Bell Media revenue surged 8.9% on FIFA World Cup and Crave subscriber growth
- Ziply Fiber posted record 99,600 residential net adds; build ramp expected in H2



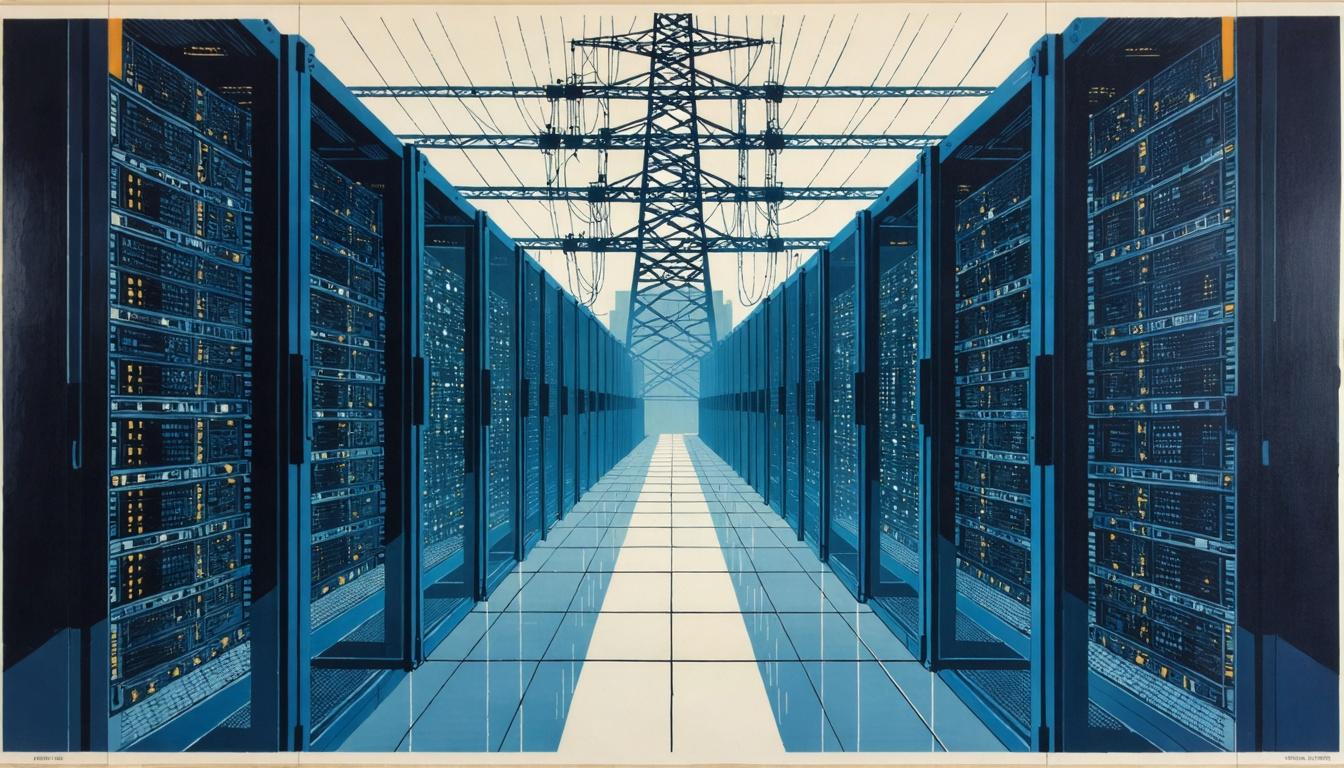
*this image is generated using AI for illustrative purposes only.
BCE Inc. (NYSE: BCE) reported a 1.5% increase in consolidated revenue and 1% growth in adjusted EBITDA for the second quarter of 2026. The Canadian telecommunications company generated more than $1 billion in free cash flow while reducing its net debt leverage ratio to approximately 3.7 times.
The results reflect disciplined execution across core telecom operations and strategic investments in AI infrastructure and U.S. fiber expansion. Bell Media delivered an 8.9% revenue increase, supported by FIFA World Cup coverage and subscriber growth at Crave.
Financial Performance
Consolidated revenue rose 1.5% year over year, driven by contributions from Ziply Fiber and Bell Media. Adjusted EBITDA grew 1%, with the margin remaining stable at 43.8%. Adjusted earnings per share increased by 2 cents to 65 cents, aided by higher adjusted EBITDA and the absence of non-cash mark-to-market losses on foreign exchange hedges recorded in the prior year period.
Capital expenditure increased by $317 million year over year, reflecting investments in Ziply Fiber’s U.S. buildout and Bell AI Fabric. Excluding these accretive AI investments, Canadian telecom capital spending declined, consistent with the company’s multi-year reduction strategy. Free cash flow exceeded $1 billion, tracking consistent with full-year 2026 guidance despite higher capital outlays.
Segment Highlights
Bell CTS Canada
Wireless trends improved with postpaid churn reaching its lowest quarterly level in three years at 1.02%, down 4 basis points year over year. The segment delivered 41,594 postpaid mobile phone net adds. Residential fiber-to-the-home (FTTH) internet net adds totaled 45,271, contributing to 14.2% internet revenue growth. Video net adds improved to 8,741, compared to a net loss of 15,851 in the prior year quarter, driven by streaming bundle uptake.
Adjusted EBITDA margin for Bell CTS Canada expanded by 40 basis points to 46.1%, supported by a 4.7% decline in operating costs. Wireless product revenue fell 6.6% as the company reduced hardware discounting to improve margins.
Ziply Fiber
Ziply Fiber reported its highest quarterly residential net adds since acquisition, reaching 99,600. Revenue remained broadly stable sequentially as fiber growth offset legacy copper declines. Adjusted EBITDA was $95 million, representing a 40.6% margin. Build activity is expected to ramp significantly in the second half of 2026, with permit submissions accelerating fourfold from April to June.
Bell Media
Bell Media revenue grew 8.9% year over year, driven by strong performance during the FIFA World Cup and Formula One coverage. Crave subscribers surpassed 5 million, growing 23% year over year to 5.1 million, with direct-to-consumer streaming subscriptions up 49%. Digital video advertising revenue increased 39%.
What the Numbers Show
The divergence between capital expenditure growth and free cash flow generation highlights the structural shift in BCE’s investment profile. While total capex rose $317 million year over year, primarily due to AI Fabric and Ziply Fiber builds, the company still generated over $1 billion in free cash flow. This indicates that organic cash generation from the core Canadian telecom business remains robust enough to fund significant new growth initiatives without immediate dilution to liquidity. Additionally, the 40 basis point expansion in Bell CTS Canada’s adjusted EBITDA margin, alongside a 4.7% drop in operating costs, demonstrates successful cost discipline even as wireless product revenue declined 6.6% due to reduced device discounting.
Balance Sheet and Outlook
BCE ended the quarter with $4.6 billion in total available liquidity. The reported net debt leverage ratio improved to approximately 3.7 times, down about 1 times since the fourth quarter of 2025. This improvement was supported by $2.5 billion in public debt offerings completed in June and debt repurchases below par value. The company reconfirmed its target to achieve a 3.5 times leverage ratio by the end of 2027.

How will the accelerated Ziply Fiber buildout in H2 2026 impact BCE's ability to maintain its target leverage ratio of 3.5x by the end of 2027?
What is the expected timeline for Bell AI Fabric investments to begin contributing materially to revenue and offsetting the increased capital expenditure?
Can Bell Media sustain its 8.9% revenue growth trajectory post-FIFA World Cup, or will earnings normalize as major sports events conclude?
 19
19








 Create Custom Screeners
  Access 200+ Pre-built Filters
  Use 50+ Readymade Screener





