

Bata India Q1FY27 revenue up 3.9%, underlying PBT rises 22%


Bata India Ltd posted Q1FY27 revenue of ₹9,789 Mn, up 3.9% YoY, with adjusted PBT rising 22% to ₹907 Mn. Gross margin expanded 130 bps despite channel mix dilution. The company declared a ₹25 interim dividend and crossed 2,000 EBO stores. Management cited 5-6% raw material cost inflation, offset by price hikes, and highlighted progress in inventory efficiency and franchise expansion.


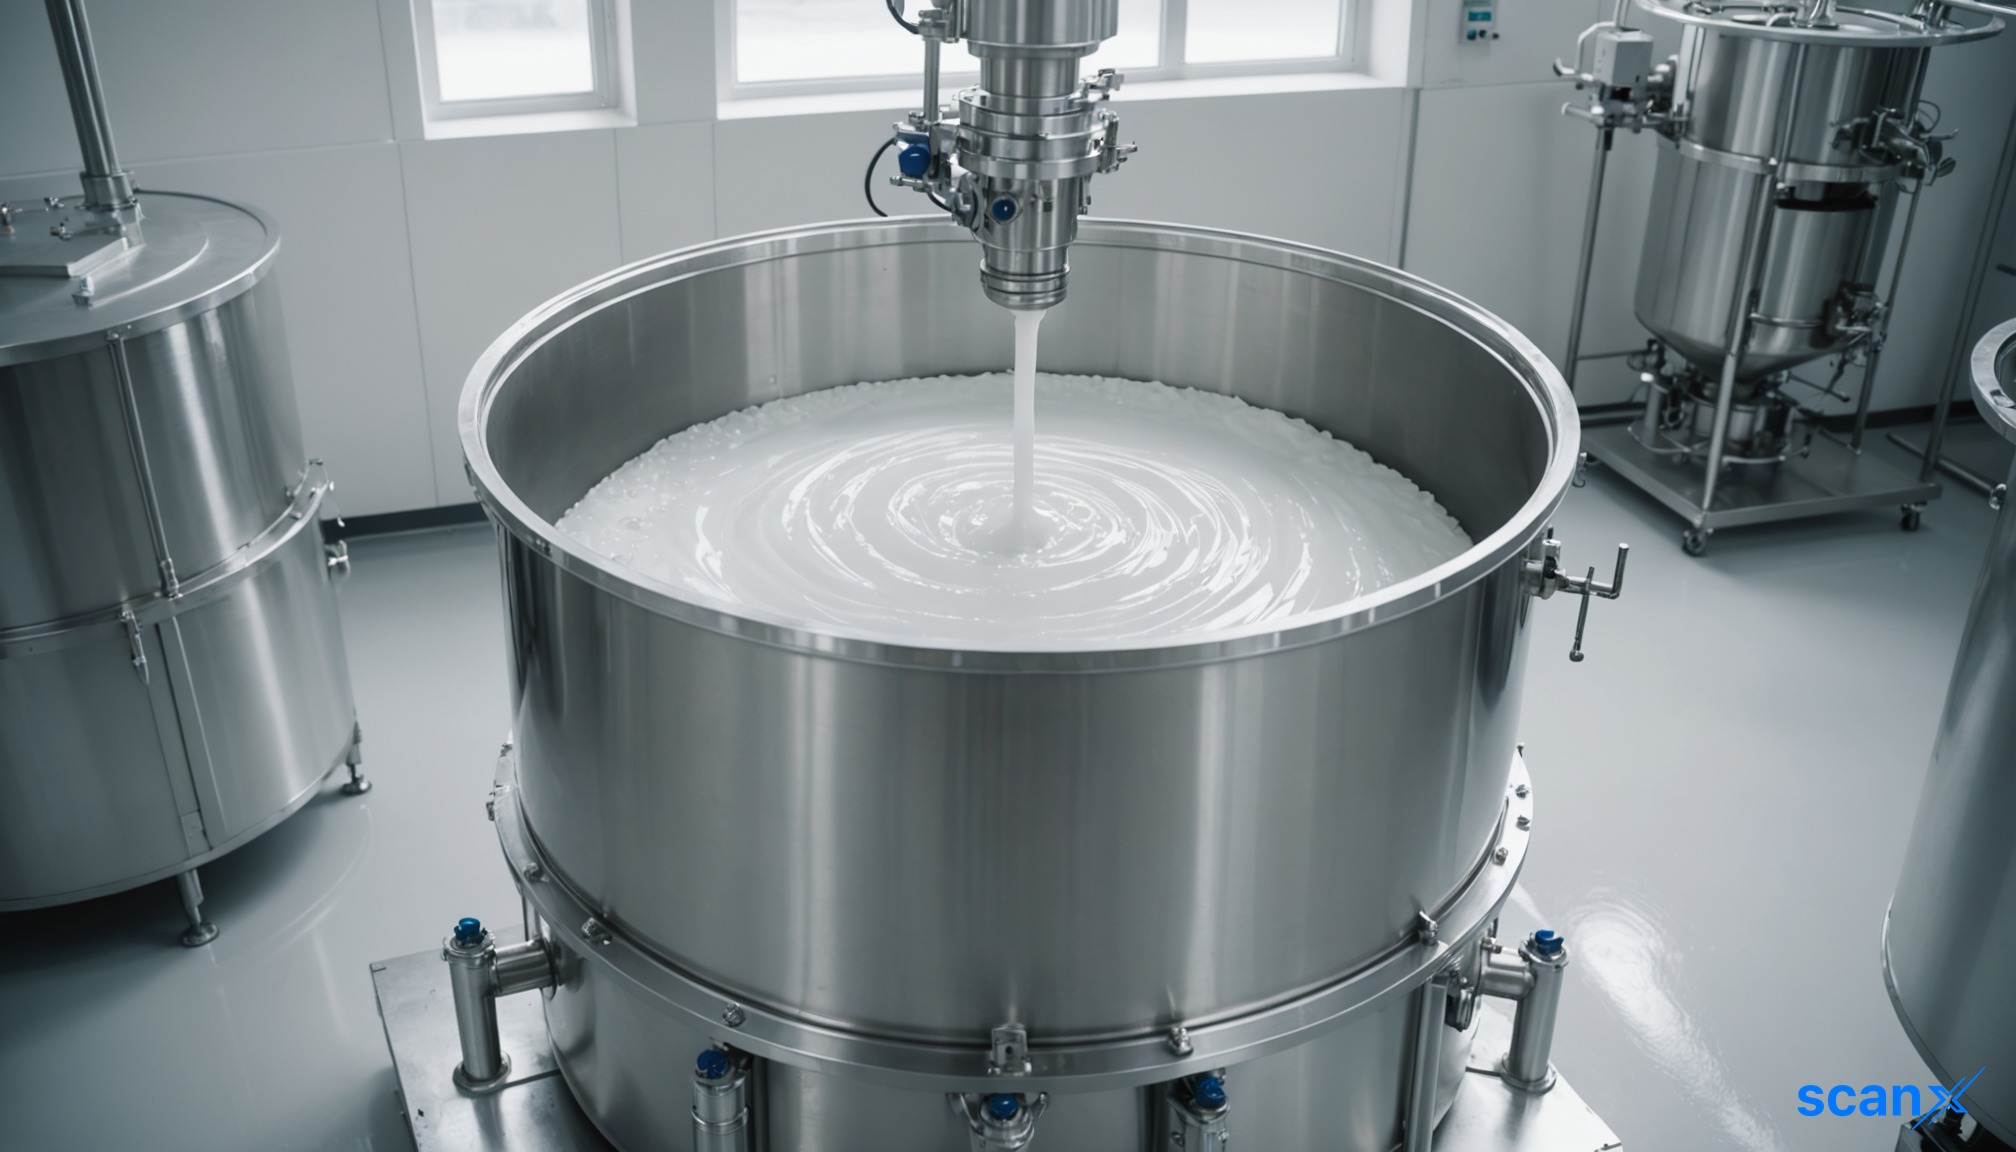
*this image is generated using AI for illustrative purposes only.
Bata India Limited reported revenue from operations of ₹9,789 Mn for the quarter ended June 30, 2026 (Q1FY27), marking a 3.9% year-on-year increase. The growth was underpinned by a 2.3% rise in volume and favorable average selling price (ASP) movements across its retail network. Underlying pre-tax profit (PBT) grew by 22%, signaling improved operational leverage despite a significant increase in advertising spend. The company crossed the landmark of 2,000 Exclusive Brand Outlet (EBO) stores, becoming the first brand in the country to achieve this milestone.
The company submitted its investor presentation to the Bombay Stock Exchange, National Stock Exchange of India Limited, and The Calcutta Stock Exchange Limited on August 12, 2026, pursuant to Regulation 30 read with Part A of Schedule III of the SEBI (Listing Obligations and Disclosure Requirements) Regulations, 2015. A post-earnings conference call was held on August 13, 2026, hosted by Ambit Capital Private Limited.
Financial Performance
Revenue from operations stood at ₹9,789 Mn in Q1FY27, compared to ₹9,421 Mn in Q1FY26. Gross margin expanded by 130 basis points to ₹5,360 Mn. Cash operating profit rose 7.6% YoY to ₹2,166 Mn.
| Metric | Q1FY26 | Q1FY27 | Change |
|---|---|---|---|
| Revenue from Operations | ₹9,421 Mn* | ₹9,789 Mn | +3.9% |
| Gross Margin | ₹5,180 Mn* | ₹5,360 Mn | +130 bps |
| Reported PBT | ₹697 Mn | ₹856 Mn | +22.8% |
| Adjusted PBT | ₹745 Mn | ₹907 Mn | +21.7% |
| PBT Margin | 8.0%* | 9.3% | +135 bps |
| Cash Operating Profit | ₹2,013 Mn* | ₹2,166 Mn | +7.6% |
Figures for Q1FY26 are derived or approximated based on disclosed changes where exact prior values were not explicitly tabulated but implied by growth rates or adjustments.
Reported PBT increased from ₹697 Mn to ₹856 Mn. After adjusting for one-time items — including a ₹48 Mn voluntary retirement scheme (VRS) charge in Q1FY26 and ₹51 Mn in exceptional costs (₹28 Mn FX loss on license fees and ₹23 Mn ERP one-time cost) in Q1FY27 — adjusted PBT rose to ₹907 Mn from ₹745 Mn. The PBT margin improved by 135 basis points to 9.3%.
Dividend Declaration
Subsequent to the quarter ended June 30, 2026, the Board of Directors in its meeting held on August 11, 2026, declared an interim dividend of ₹25.00 per equity share. This represents a payout of 500% on an equity share of par value ₹5 each.
Operational Highlights
The retail segment contributed significantly to growth, with Zero Base Merchandising (ZBM) rolled out to 775 doors, representing approximately 80% of business contribution. Franchise stores expanded to 750 units, delivering high double-digit growth. Digital channels also accelerated, with e-commerce growing 13% YoY and Bata.com surging 25%. The Bata mobile app recorded over 300,000 downloads, contributing ~14% to Bata.com’s business. B2C sales grew 42%, supported by 1,050+ stores fulfilling online orders.
Distribution reach extended to 1,678 towns via 17,000+ Multi-Brand Outlets (MBOs). Key Retail Outlets (KROs) expanded to 3,472, a 2.3x increase from June 2025, with a target to cross 4,000 by Q2'27. Secondary sales growth remained in double digits.
Inventory and Product Efficiency
Inventory management saw significant improvements, with stock levels reduced by 37% compared to Q1'24. Stock turns improved to 2.54 from 1.88 in Q1'24, indicating better capital efficiency. Product availability improved by ~12%, while store clutter was reduced through a ~30% cut in lines at stores. Full-price sales rose to 88.0% in Q1FY27 from 73.0% in Q1FY26, reflecting controlled markdowns and stronger demand planning.
What the Numbers Show
The divergence between revenue growth (+3.9%) and underlying PBT growth (+22%) highlights Bata India’s focus on margin expansion through operational efficiencies rather than pure top-line acceleration. The 37% inventory reduction alongside improved stock turns suggests a deliberate strategy to enhance working capital efficiency, which likely contributed to the 135 bps expansion in PBT margin. This shift indicates a maturing operational model where profitability is being prioritized through disciplined inventory management and product funnel optimization.
Brand and Marketing Initiatives
Brand consideration scores improved from 60 in 2024 to 66 in 2026, a six-point gain over three years. The “Make Your Way” campaign drove category growth, particularly in ladies’ footwear, where turnover increased 12% YoY to ~₹112 Mn. Media spend surged 240% in Q1FY27 compared to Q1FY26, supporting aggressive brand building. Google My Business (GMB) ratings improved to 4.85 from 4.55 last year, and Net Promoter Score (NPS) rose to 88 from 87.
Management Commentary and Outlook
During the earnings call, management noted that raw material cost inflation, largely driven by imported synthetics, was in the range of 5% to 6%. The company has implemented commensurate price increases to mitigate this impact, though the full effect will be visible in subsequent quarters due to inventory holding periods of 140–150 days. Hush Puppies and Floatz led brand-wise growth, while the Bata brand saw resurgence in the ladies’ category. NorthStar sneakers were described as a drag, with management rationalizing lines for a stronger future collection.
Management highlighted that channel mix dilution impacted gross margins by approximately 100 basis points, primarily due to faster growth in lower-margin franchise channels. Without this mix shift, gross margin would have expanded by ~230 basis points. The company aims to consolidate its manufacturing partners from over 100 three years ago to about 30 core and satellite partners over the next 3–5 years, expecting long-term margin benefits of around 200 basis points from supply chain efficiencies and product funnel reimagining.
Historical Stock Returns for Bata
| 1 Day | 5 Days | 1 Month | 6 Months | 1 Year | 5 Years |
|---|---|---|---|---|---|
| +3.67% | +5.85% | -0.23% | -13.75% | -43.17% | 0.0% |

How will the consolidation of manufacturing partners from over 100 to ~30 impact Bata India's supply chain resilience and cost structure in the next 3-5 years?
What specific strategies will management employ to reverse the performance drag of the NorthStar sneakers brand and improve its contribution to overall growth?
Will the aggressive 240% increase in media spend be sustained in subsequent quarters, and how might this affect near-term profit margins despite improved operational leverage?










 Access 50+ Readymade Screeners
  Use 200+ Custom Filters
  Get Full Market Insights





