

Baker Hughes Q2 EPS beats estimates as AI power demand surges


Baker Hughes delivered strong Q2 results with adjusted EPS of $0.64, beating consensus. Total orders rose 49% to $10.5 billion, led by IET segment growth fueled by AI data center power demand and LNG infrastructure. The company completed the acquisition of Chart Industries, expecting $325 million in annual cost synergies by year three.



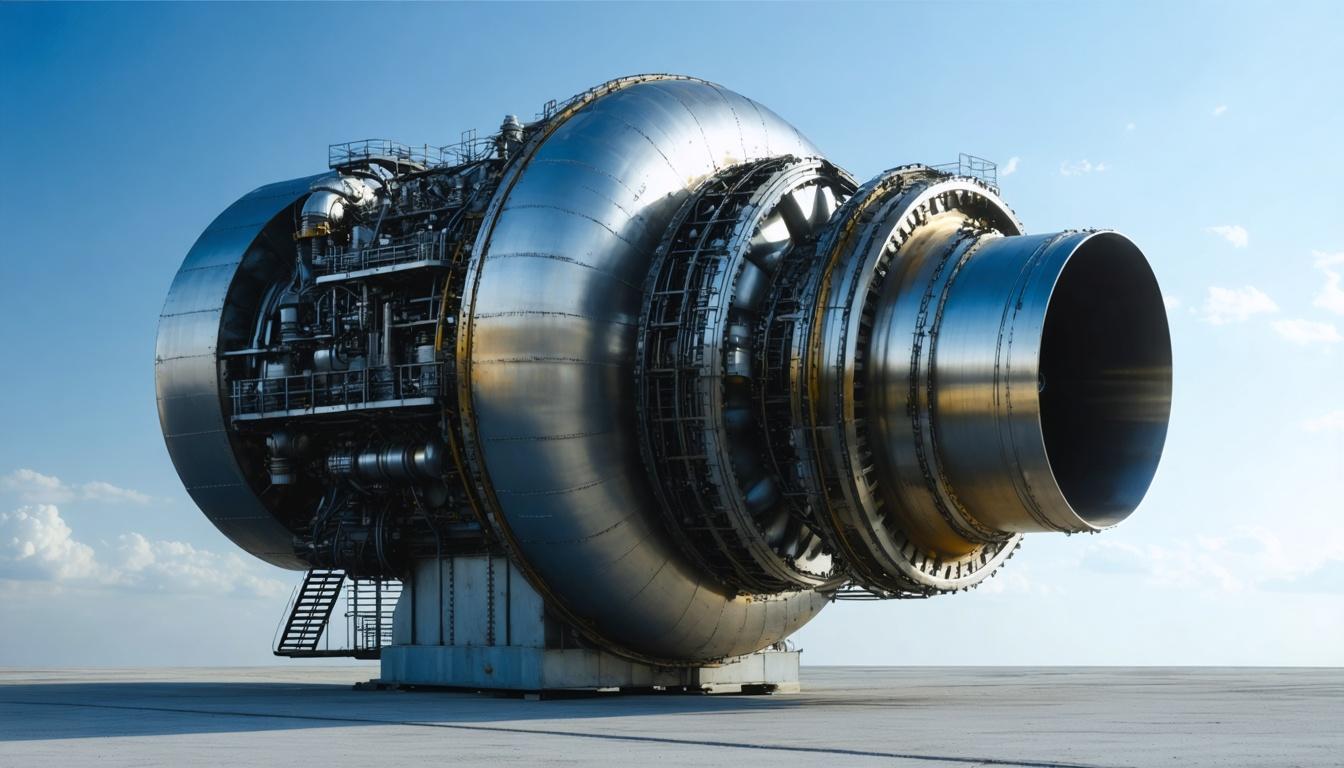
*this image is generated using AI for illustrative purposes only.
Baker Hughes Co. (NASDAQ: BKR) delivered a strong second-quarter performance in 2026, reporting adjusted earnings per share (EPS) of $0.64, which exceeded the analyst consensus estimate of $0.50 by 28 percent. The company’s results highlighted robust operational resilience and significant momentum in its order book, with total orders rising 49 percent year-over-year to $10.5 billion. This surge was primarily driven by the Industrial & Energy Technology (IET) segment, which secured record bookings of $7.1 billion, doubling its prior-year figure. CEO Lorenzo Simonelli attributed the growth to strong demand across data centers, gas infrastructure, and upstream markets, noting that energy security and increasing power needs are driving investment across both energy and industrial value chains.
The quarterly financials revealed that Baker Hughes’ adjusted EPS rose 1.59 percent year-over-year from $0.63 per share recorded in the same period last year. Total revenue for the quarter stood at $6.742 billion, beating the analyst consensus estimate of $6.523 billion by 3.35 percent, although it represented a 2.43 percent decrease from the $6.910 billion reported in Q2 2025. The decline in revenue was mainly attributed to the dispositions of Precision Sensors & Instrumentation (PSI) and Surface Pressure Control (SPC) businesses. However, the company’s total book-to-bill ratio reached 1.6, with the IET segment achieving an impressive ratio of 2.2.
Financial Performance Overview
Baker Hughes reported net income attributable to the company of $681 million, down 3 percent year-over-year from $701 million. Adjusted net income, a non-GAAP measure excluding specific items such as restructuring costs and gains/losses on business dispositions, increased 3 percent year-over-year to $640 million. Adjusted EBITDA rose 2 percent year-over-year to $1,231 million, driven by productivity gains, pricing benefits, and foreign exchange tailwinds, partially offset by inflation and lower volume in certain segments. Free cash flow for the quarter was strong at $1,109 million, up significantly from $239 million in the prior year period, supported by operating cash flows of $1,345 million.
| Metric | Reported Value | Estimate | Beat/Miss | YoY Change |
|---|---|---|---|---|
| Adjusted EPS | $0.64 | $0.50 | +28% | +1.59% |
| Sales | $6.742 billion | $6.523 billion | +3.35% | -2.43% |
| Orders | $10.5 billion | N/A | N/A | +49% |
| Adj. EBITDA | $1.231 billion | N/A | N/A | +2% |
Segment Highlights and Strategic Moves
The Industrial & Energy Technology (IET) segment was a key growth driver, with orders surging 101 percent year-over-year to $7.088 billion. This strength was fueled by robust demand across Power Systems and Liquefied Natural Gas (LNG) markets. Notable awards included a major contract with Venture Global for six LNG blocks and significant agreements with Cheniere and Bechtel. In July, Baker Hughes completed the acquisition of Chart Industries, Inc., enhancing its portfolio in thermal management and compression technologies. Chart will become Baker Hughes’ third reporting segment due to its strategic importance. The company expects the acquisition to generate $325 million in annual cost synergies by the third year, including $95 million in the first year and $230 million in the second.
In the Oilfield Services & Equipment (OFSE) segment, revenue decreased 5 percent year-over-year to $3.451 billion, impacted by Middle East disruptions and the SPC disposition. However, OFSE orders increased 4 percent sequentially to $3.413 billion. The segment secured strategic contracts, including extensions with Equinor in Norway and Petrobras in Brazil, as well as new wireline services agreements with Oil and Natural Gas Corporation of India.
Outlook and Dividend
For the third quarter, Baker Hughes expects revenue between $6.57 billion and $7.17 billion and adjusted EBITDA of $1.115 billion to $1.295 billion. For fiscal 2026, the company forecast revenue of $26.65 billion to $28.05 billion and adjusted EBITDA of $4.60 billion to $5.10 billion. The company also raised its full-year Industrial & Energy Technology orders guidance and increased its Horizon 2 IET orders target to more than $45 billion, citing strong demand across Power Systems and liquefied natural gas projects, particularly in power generation.
The board declared a quarterly cash dividend of 23 cents per share, payable Aug. 17 to shareholders of record as of Aug. 7.
What the Numbers Show
The divergence between the earnings beat and the revenue decline suggests that Baker Hughes successfully improved its profit margins during the quarter. While sales fell by 2.43 percent year-over-year to $6.742 billion, the ability to generate an adjusted EPS of $0.64 — up 1.59 percent from the previous year’s $0.63 — indicates that the company is extracting more value from each dollar of revenue. This margin expansion likely offset the volume or price pressures that contributed to the lower sales figures compared to the prior year’s $6.910 billion. Furthermore, the record backlog of $40.1 billion, including a record $37.1 billion in IET remaining performance obligations (RPO), provides high visibility for future revenue streams, reinforcing management’s confidence in achieving the midpoint of full-year guidance despite ongoing geopolitical uncertainties in the Middle East.

How will the integration of Chart Industries impact Baker Hughes' operational efficiency and timeline for achieving the projected $325 million in annual cost synergies?
To what extent could ongoing geopolitical disruptions in the Middle East affect the Oilfield Services & Equipment segment's ability to meet its sequential order growth targets?
Will the record $37.1 billion backlog in the Industrial & Energy Technology segment be sufficient to sustain revenue growth if global LNG project approvals slow down?
 15
15














 Create Custom Screeners
  Access 200+ Pre-built Filters
  Use 50+ Readymade Screener





