

Ashok Leyland August sales rise 38% to 21,038 units, beat estimate


- Ashok Leyland sold 21,038 vehicles in August 2026, a 38% YoY rise
- M&HCV truck sales surged 60% to 10,748 units, leading the growth
- LCV sales increased 25% to 7,319 units
- Total sales beat the analyst estimate of 20,000 units
- Cumulative sales for Jan-Aug 2026 rose 20% to 89,391 units

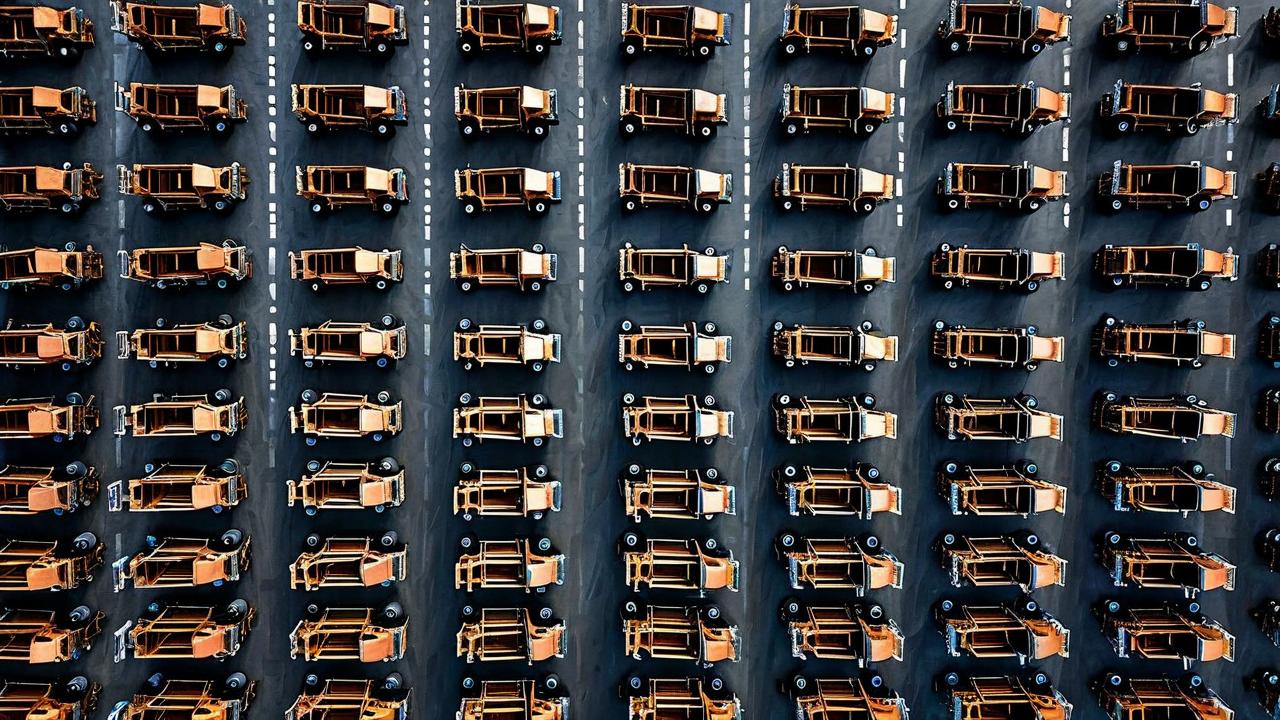

*this image is generated using AI for illustrative purposes only.
Ashok Leyland reported total vehicle sales of 21,038 units in August 2026, up 38% from 15,239 units in the same month last year. The figure beat the analyst estimate of 20,000 units, driven by strong demand in the medium and heavy commercial vehicle (M&HCV) segment.
Sales performance at a glance
The August figures reflect robust year-on-year volume growth across both domestic and export markets. The following table summarises the key data points for total vehicles:
| Metric | August 2026 | August 2025 | YoY Change |
|---|---|---|---|
| Total vehicles (units) | 21,038 | 15,239 | 38% |
Segment-wise breakdown
The growth was broad-based, with significant contributions from both M&HCV and light commercial vehicles (LCV). M&HCV trucks saw the highest momentum, rising 60% to 10,748 units. LCV sales also expanded by 25% to 7,319 units. However, M&HCV bus sales grew at a more modest pace of 12%.
| Category | Aug 2026 (Units) | Aug 2025 (Units) | YoY Change |
|---|---|---|---|
| M&HCV Trucks | 10,748 | 6,738 | 60% |
| M&HCV Bus | 2,971 | 2,643 | 12% |
| Total M&HCV | 13,719 | 9,381 | 46% |
| LCV | 7,319 | 5,858 | 25% |
| Total Vehicles | 21,038 | 15,239 | 38% |
Domestic vs Export dynamics
Domestic sales accounted for 19,438 units in August 2026, up 43% from 13,622 units in August 2025. The export contribution helped boost the overall M&HCV truck numbers, which were higher in the combined domestic plus export figure compared to domestic alone. Cumulative sales for the period ending August 2026 stood at 89,391 units, up 20% from 74,541 units in the same period last year.
What the Numbers Show
The disproportionate growth in M&HCV trucks (60%) compared to M&HCV buses (12%) suggests a stronger recovery in freight logistics demand relative to passenger transport. With M&HCV trucks constituting over half of the total monthly volume, this segment remains the primary driver of Ashok Leyland's top-line momentum. The consistent double-digit growth in LCVs indicates sustained strength in the last-mile delivery segment as well.
Historical Stock Returns for Ashok Leyland
| 1 Day | 5 Days | 1 Month | 6 Months | 1 Year | 5 Years |
|---|---|---|---|---|---|
| -2.43% | -4.77% | -11.15% | -9.20% | +10.52% | 0.0% |

How will the sustained 60% growth in M&HCV truck sales impact Ashok Leyland's capacity utilization and supply chain logistics in the coming quarters?
What specific infrastructure projects or government policies are driving the disproportionate recovery in freight logistics compared to passenger transport?
Will Ashok Leyland need to accelerate its electric vehicle (EV) production roadmap to meet the rising demand in the M&HCV segment amidst tightening emission norms?
 20
20







 Access Market Heat-map & Insights
  Create, Save & Share your Screener
  Use 200+ Screening Filters





