

Anuh Pharma net profit rises 37.6% in Q1FY27 on margin expansion


Anuh Pharma's Q1FY27 standalone results show a 37.6% increase in net profit to ₹1,142.49 lakh, fueled by EBITDA margin expansion to 9.47% from 7.34%. Revenue grew 3.9% to ₹19,381.04 lakh. Promoters withdrew share reclassification applications.


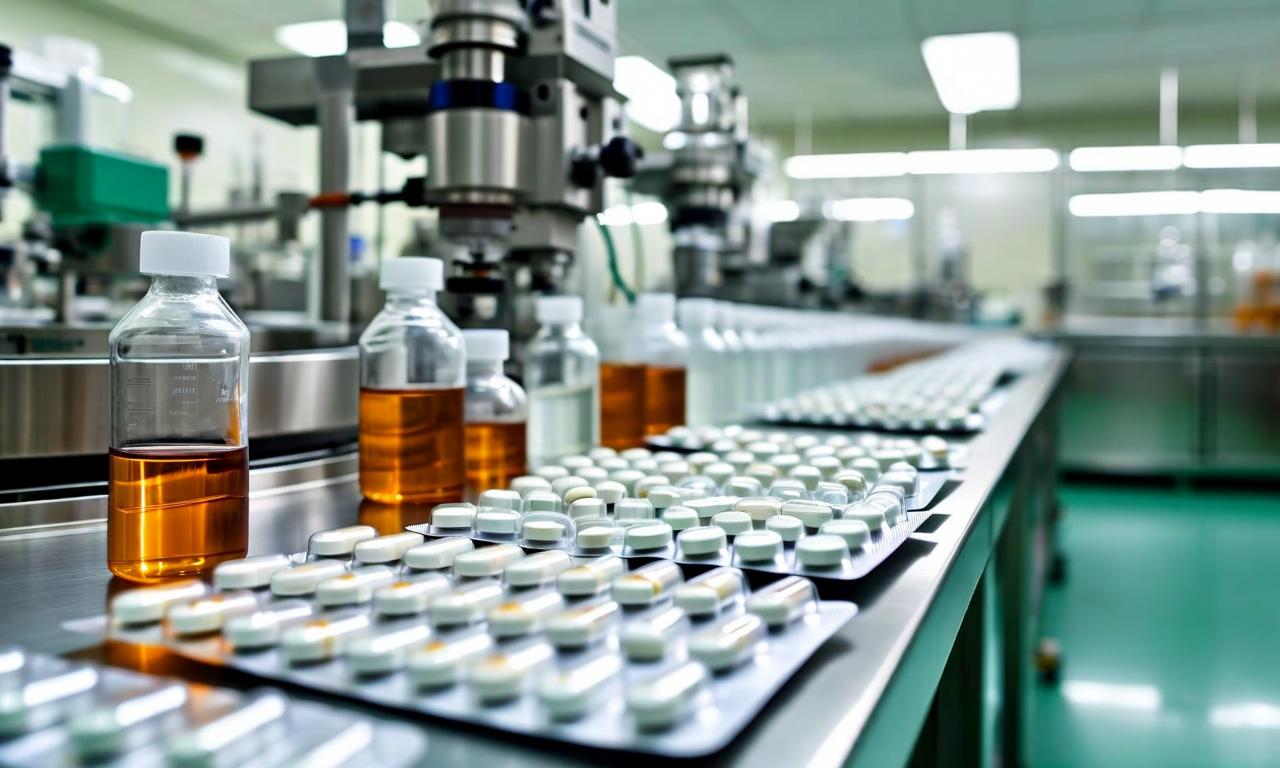
*this image is generated using AI for illustrative purposes only.
Anuh Pharma Limited reported a net profit after tax of ₹1,142.49 lakh for the quarter ended June 30, 2026, marking a 37.6% year-on-year increase from ₹830.12 lakh in Q1FY26. The improvement in profitability was primarily driven by an expansion in EBITDA margin, which widened to 9.47% from 7.34% in the prior year period, even as revenue from operations grew modestly by 3.9% to ₹19,381.04 lakh. This divergence between top-line and bottom-line growth highlights improved operational efficiency during the quarter.
The Board of Directors approved the unaudited standalone financial results on August 7, 2026, pursuant to Regulation 30 and Regulation 33 of the SEBI (Listing Obligations and Disclosure Requirements) Regulations, 2015. The results were subjected to a limited review by the statutory auditors, Jayantilal Thakkar & Co. Dilip J. Thakkar, Partner at Jayantilal Thakkar & Co., issued the independent auditor's review report confirming that the statement discloses information required under the Listing Regulations. The company also published advertisements regarding these results in Financial Express (English) and Mumbai Lakshdeep (Marathi) on August 9, 2026, as per Regulation 47.
Financial Performance Highlights
The following table summarises the key financial metrics for the quarter under review compared to the prior year period:
| Metric | Q1FY27 | Q1FY26 | Change |
|---|---|---|---|
| Revenue from Operations | ₹19,381.04 lakh | ₹18,647.84 lakh | +3.9% |
| EBITDA | ₹1,835.44 lakh | ₹1,367.84 lakh | +34.2% |
| EBITDA Margin | 9.47% | 7.34% | +213 bps |
| Net Profit After Tax | ₹1,142.49 lakh | ₹830.12 lakh | +37.6% |
| EPS (Basic) | ₹1.14 | ₹0.83 | +37.3% |
Corporate Developments
In addition to the financial results, the Board addressed shareholding pattern disclosures. Three members of the Promoter Group — Vikram Kirtilal Shah, Kiran Piyush Shah, and Kinjal Siddharth Jhaveri — withdrew their earlier applications for reclassification from the 'Promoter' category to the 'Public' category under Regulation 31A of the SEBI LODR Regulations, 2015. These shareholders will continue to be classified as part of the Promoter Group. Collectively, they hold 8,31,748 equity shares, representing 0.83% of the total shareholding.
The company also adopted a revised Policy on Related Party Transactions during the meeting, which is available on its website. All per-share figures in the financial results reflect the impact of the 1:1 bonus share issuance approved by shareholders in September 2025 and allotted on July 16, 2025. The paid-up equity share capital stands at ₹5,011.20 lakh following the bonus issue.
Historical Stock Returns for Anuh Pharma
| 1 Day | 5 Days | 1 Month | 6 Months | 1 Year | 5 Years |
|---|---|---|---|---|---|
| -3.53% | -1.61% | -14.56% | -3.64% | +0.66% | -28.32% |

Can Anuh Pharma sustain the 213 bps EBITDA margin expansion in subsequent quarters, or was this driven by one-off cost efficiencies?
How will the withdrawal of the promoter reclassification applications impact future liquidity and shareholding pattern dynamics for institutional investors?
Given the modest 3.9% revenue growth, what specific strategies is management deploying to accelerate top-line expansion in FY27?
 17
17






 Create Custom Screeners
  Access 200+ Pre-built Filters
  Use 50+ Readymade Screener





