

Ambar Protein Q1 Results: Net profit rises 403% YoY to ₹3.75 crore


Ambar Protein Industries posted a strong Q1FY27 with net profit surging to ₹3.75 crore, up 403% YoY, despite a slight revenue dip to ₹113.45 crore. EPS rose to ₹6.53 from ₹1.30. The results reflect improved operational margins without any exceptional items.


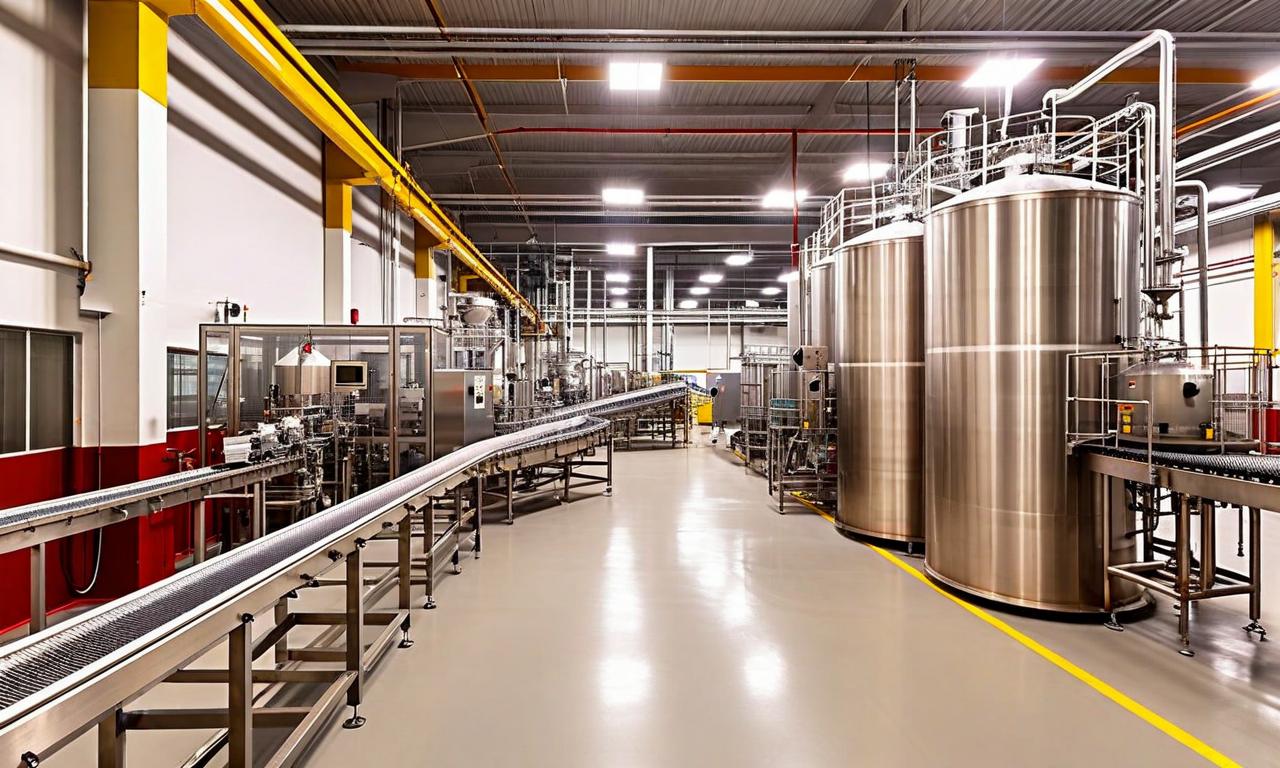
*this image is generated using AI for illustrative purposes only.
Ambar Protein Industries reported a substantial improvement in profitability for the first quarter of FY27, with net profit after tax rising to ₹3.75 crore compared to ₹0.75 crore in the corresponding period of FY26. This represents a year-on-year increase of over 400%, signaling a recovery in the company’s bottom line despite modest headwinds on the top line.
Revenue from operations for the quarter ended June 30, 2026, stood at ₹113.45 crore, a slight decline from ₹117.27 crore recorded in Q1FY25. For the full fiscal year ended March 31, 2026, the company logged total income from operations of ₹500.66 crore.
Financial Performance
The company’s pre-tax profit for the quarter was ₹5.11 crore, up from ₹1.47 crore in the previous year. No exceptional or extraordinary items were reported in the statement of profit and loss for either period. Earnings per share (basic and diluted) increased to ₹6.53 per equity share of face value ₹10 each, compared to ₹1.30 in Q1FY25.
| Metric | Q1FY27 (Unaudited) | Q1FY26 (Unaudited) | FY26 (Audited) |
|---|---|---|---|
| Total Income from Operations (₹ crore) | 113.45 | 117.27 | 500.66 |
| Net Profit Before Tax (₹ crore) | 5.11 | 1.47 | 9.39 |
| Net Profit After Tax (₹ crore) | 3.75 | 0.75 | 7.03 |
| EPS Basic (₹) | 6.53 | 1.30 | 12.25 |
What the Numbers Show
The divergence between revenue and profit trends highlights an improvement in operational efficiency or cost management during the quarter. While revenue contracted by approximately 3.3% year-on-year, net profit expanded more than fourfold. This suggests that fixed costs were better absorbed or input costs declined relative to selling prices, allowing margins to expand despite lower sales volume. The absence of exceptional items indicates that the profit growth was driven by core operational performance rather than one-off gains.
Historical Stock Returns for Ambar Protein Industries
| 1 Day | 5 Days | 1 Month | 6 Months | 1 Year | 5 Years |
|---|---|---|---|---|---|
| +4.22% | 0.0% | -7.44% | +15.66% | -27.11% | 0.0% |

What specific operational efficiencies or cost-saving measures drove the 400% profit surge despite a 3.3% revenue decline?
How sustainable are the expanded margins if input costs rise or sales volumes remain stagnant in Q2FY27?
Does management attribute the revenue contraction to seasonal factors, reduced demand, or strategic pricing adjustments?
 18
18









 Access 50+ Readymade Screeners
  Use 200+ Custom Filters
  Get Full Market Insights





