

Allcargo Global LCL volume falls 7% in August amid efficiency gains


- LCL volume fell 7% YoY to 711,000 cbm in August 2026 due to trade lane rationalization
- FCL volume declined 5% YoY to 51,023 TEUs but rose 4% MoM
- Air volume dropped 6% YoY to 2,796 tons, with regional variations
- Container utilization index improved to 101, up from 100 in August 2025
- 40-foot container usage index rose to 106, indicating better cost efficiency

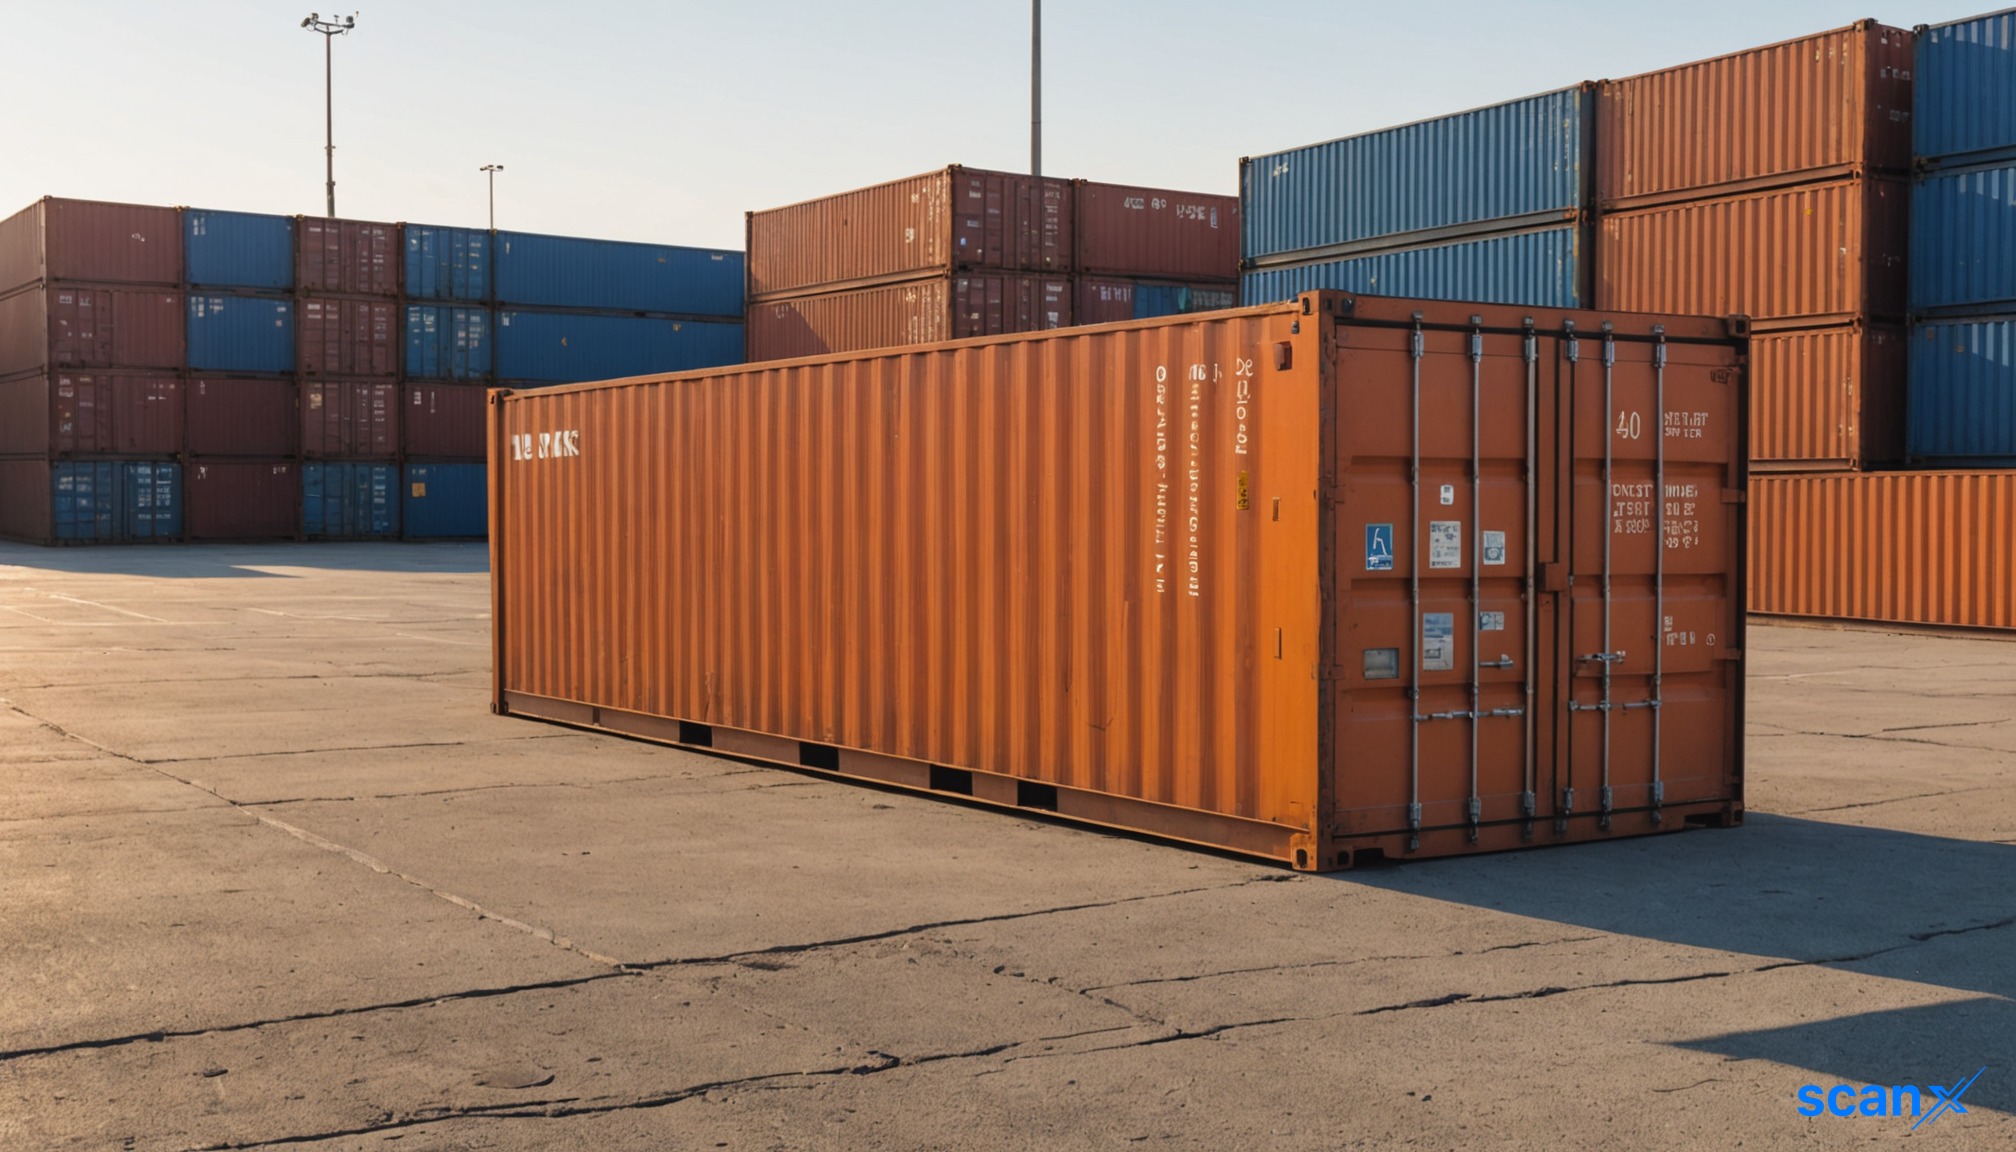

*this image is generated using AI for illustrative purposes only.
Allcargo Global Limited reported a 7% year-on-year decline in less-than-container-load (LCL) volume for August 2026, recording 711,000 cubic meters. The company attributed the drop to the rationalization of loss-making trade lanes, a move aimed at improving yields despite lower throughput.
The operational update, filed with stock exchanges on September 21, 2026, highlights a strategic shift toward efficiency. While volumes contracted across key segments, container utilization and the usage of larger 40-foot containers both rose compared to the previous year.
LCL Operations
LCL volume stood at 711,000 cbm in August 2026, down from 767,000 cbm in August 2025. This represents a 7% year-on-year decline and a 2% month-on-month decrease from July 2026’s 728,000 cbm.
The decline was observed across all major regions on a year-on-year basis. Month-on-month, volumes fell in Europe, North Asia, and the Indian Subcontinent, while remaining flat in North America, the Middle East, and Latin America.
| Month | LCL Volume ('000 cbm) |
|---|---|
| Aug-25 | 767 |
| Jul-26 | 728 |
| Aug-26 | 711 |
Management noted that peak season demand is expected to remain resilient. Coupled with constrained capacity, this dynamic is anticipated to keep freight rates elevated in the near term.
FCL Operations
Full-container-load (FCL) volume recorded at 51,023 TEUs in August 2026. This marks a 5% year-on-year decline from 54,000 TEUs in August 2025 but a 4% month-on-month increase from 49,000 TEUs in July 2026.
Year-on-year declines were seen in the Middle East, North America, and the Indian Subcontinent. Conversely, volumes increased in North Asia and Latin America. The company cited the crisis in the Middle East as a partial contributor to the year-on-year volume reduction.
| Month | FCL Volume ('000 TEUs) |
|---|---|
| Aug-25 | 54 |
| Jul-26 | 49 |
| Aug-26 | 51 |
Air Operations
Air cargo volume totaled 2,796 tons in August 2026, reflecting a 6% year-on-year decline from 2,975 tons in August 2025. However, it showed a 2% month-on-month growth from 2,751 tons in July 2026.
Air volumes declined year-on-year across all major regions except Europe and the Middle East. Month-on-month increases were recorded in Europe, the Middle East, and Latin America, while North America, North Asia, and the Indian Subcontinent saw declines.
What the Numbers Show
A clear divergence exists between volume trends and efficiency metrics. While LCL volume fell 7% year-on-year, the Container Utilization Index (TTM) rose to 101 in August 2026 from 100 in August 2025. Similarly, the 40-foot Container Usage Index increased to 106 from 100 over the same period. This suggests that despite lower overall throughput, the company is optimizing load factors and shifting toward larger, more cost-effective container units, supporting management’s claim of improved yields through rationalization.
Historical Stock Returns for Allcargo Global
| 1 Day | 5 Days | 1 Month | 6 Months | 1 Year | 5 Years |
|---|---|---|---|---|---|
| +0.07% | -8.72% | +4.23% | -33.92% | -33.92% | -33.92% |

How will the strategic exit from loss-making trade lanes impact Allcargo's long-term market share in key regions like Europe and North Asia?
Can the current rise in container utilization and 40-foot container usage sustain yield improvements if global freight rates normalize post-peak season?
What specific operational adjustments is Allcargo making to mitigate the ongoing volume declines in the Middle East and Indian Subcontinent amid geopolitical instability?
 17
17










 Access 50+ Readymade Screeners
  Use 200+ Custom Filters
  Get Full Market Insights





