
 NewsAcme Solar Holdings wins Rs 300 crore order from Seci for 300 MW assured peak power project
Acme Solar Holdings wins Rs 300 crore order from Seci for 300 MW assured peak power project


- Acme Solar Holdings secured a Rs 300 crore order from Seci for a 300 MW assured peak power project.
- The deal includes a 25-year PPA at a tariff of Rs 6.00 per kWh under the SECI-FDRE-IX tender.
- Commissioning is scheduled within 18 months from the date of PPA signing.
- The order contributes to a total disclosed order book of Rs 300.00 crore in Q2FY27.
- Company maintains strong operating margins above 85% in recent quarters.



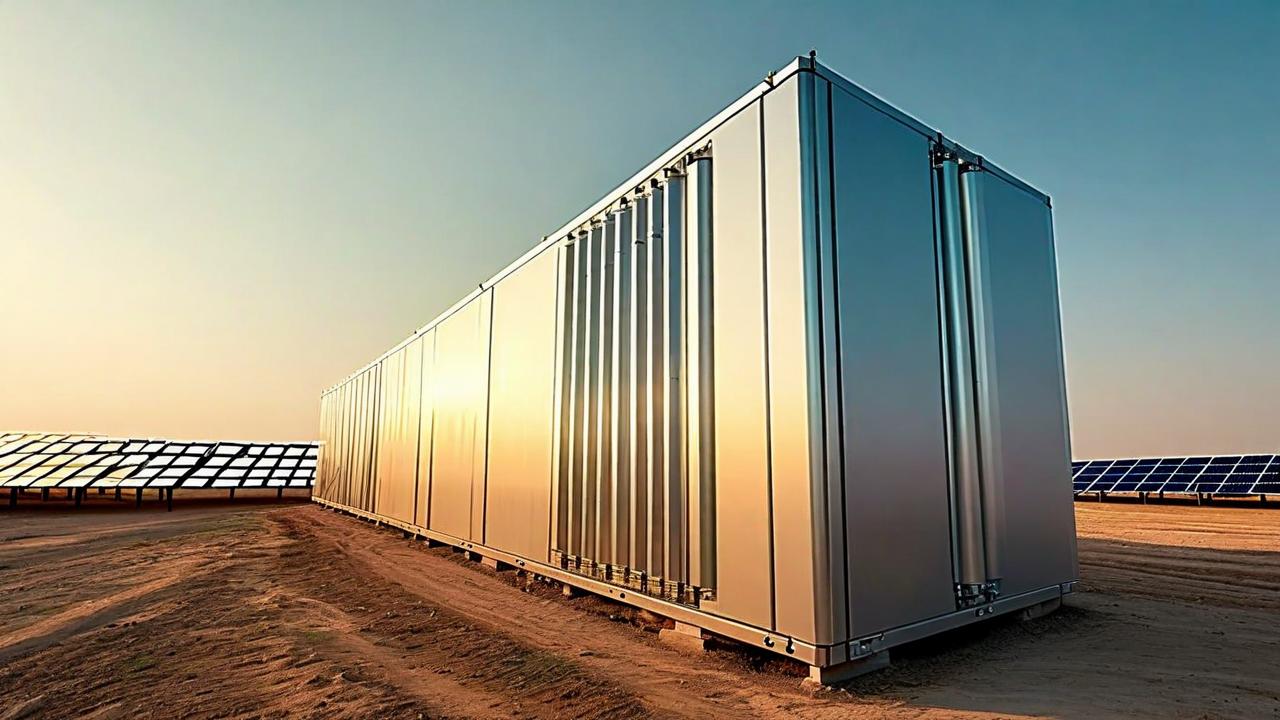
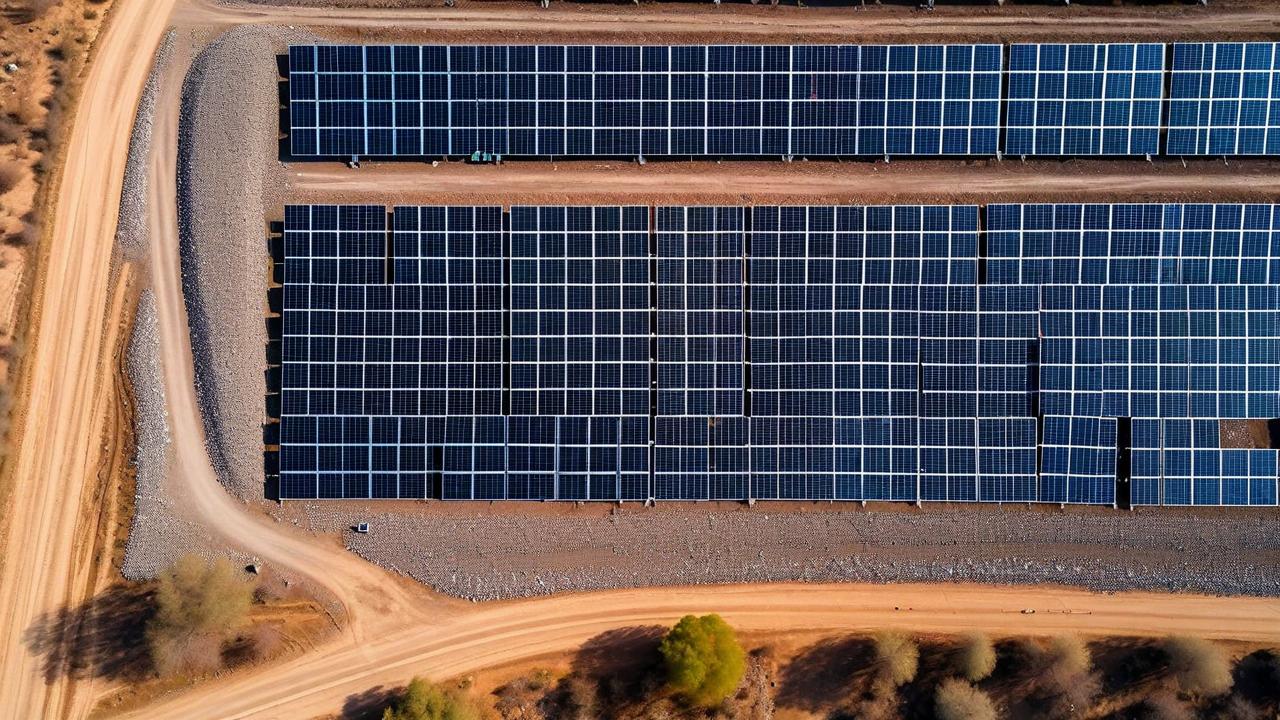
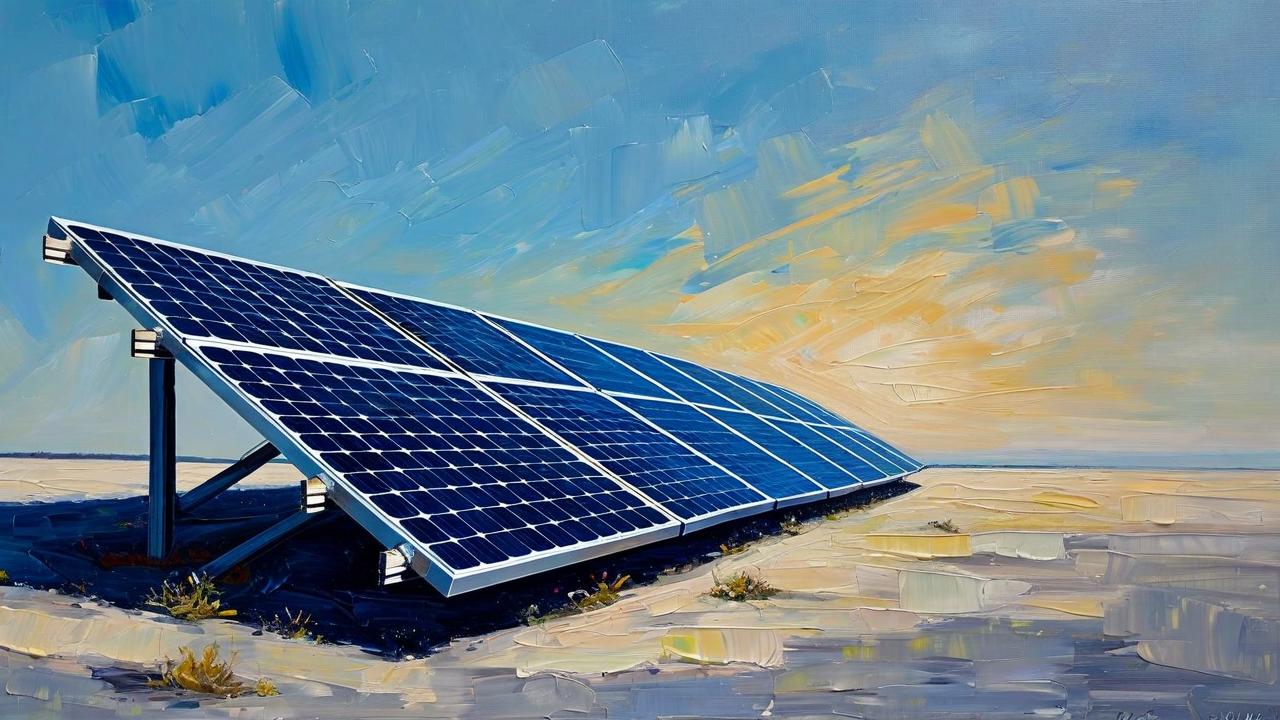
*this image is generated using AI for illustrative purposes only.
Acme Solar Holdings has won a confirmed work order worth Rs 300 crore from Seci for a 300 MW assured peak power project.
WHAT HAPPENED
Acme Solar Holdings received a confirmed work order valued at Rs 300 crore from Seci. The contract covers 300 MW capacity under the Assured Peak Power Tender with a discovered tariff of Rs 6.00 per kWh. The project involves an assured peak supply of 6,000 MWh.
ORDER IN FINANCIAL CONTEXT
The Rs 300 crore order value represents approximately 41% of the company's average quarterly revenue of Rs 723.75 crore. The total disclosed order book stands at Rs 300.00 crore across one order in the last three fiscal quarters. This provides coverage of 0.41 quarters of average quarterly revenue.
COMPANY ORDER TRACK RECORD
Order inflow data shows activity in Q2FY27. The current order size adds to the historical volume recorded in recent filings.
| Quarter | Total Order Inflow (Rs Cr) | Key Awarding Entities |
|---|---|---|
| Q2FY27 (Jul-Sep 2026) | 300.00 | Seci |
| Q4FY26 (Jan-Mar 2026) | 0.03 | Seci |
EXECUTION AND REVENUE QUALITY
The company maintains robust profitability despite evolving order visibility. Operating profit margins have remained stable above 85% in the last three quarters.
| Quarter | Revenue (Rs Cr) | Net Profit (Rs Cr) | OPM (%) |
|---|---|---|---|
| Q1FY27 | 953.70 | 235.30 | 85.63% |
| Q4FY26 | 719.20 | 138.30 | 87.40% |
| Q3FY26 | 616.60 | 113.70 | 89.46% |
REVENUE GROWTH - ORDER WINS TRANSLATING TO REVENUE
As Acme Solar Holdings has sustained order wins, its annual revenue has grown from Rs 1575.20 crore in FY25 to Rs 2022.96 crore in FY26, representing a YoY growth of +28.4% based on the latest annual data.
WORKING CAPITAL AND EXECUTION CAPACITY
The balance sheet shows a healthy current ratio of 2.17x, indicating sufficient short-term liquidity to manage operations. However, the Total Liabilities/Equity ratio is elevated at 4.64x. This figure includes trade payables and other non-debt liabilities alongside borrowings, as the source data does not isolate interest-bearing debt. Operating cashflow was positive at Rs 1543.00 crore in FY25, but free cashflow remained negative at -Rs 1723.00 crore due to high capex outlays of Rs 3266.00 crore.
WHAT TO WATCH
- Execution rate: Monitor if quarterly revenue run-rate accelerates given the new order backlog.
- Margin quality: Watch for any compression in OPM as the company executes on new contracts versus the historical average of ~87%.
- Client concentration: Assess if future orders diversify beyond Seci or remain concentrated.
- Working capital cycle: Given the high Total Liabilities/Equity, monitor operating cashflow conversion to ensure liquidity remains adequate for capex needs.
KEY OBSERVATIONS
- Backlog signal: Book-to-bill coverage is 0.41 quarters. At this level, execution capacity is supported by new orders, improving revenue visibility.
- Leverage flag: Total Liabilities/Equity of 4.64x; balance sheet carries elevated liabilities, and ability to fund working capital for the existing backlog should be monitored.
- Promoter holding: Moved from 83.29% to 71.40% in Q1FY27, a 11.89 pp change.
Historical Stock Returns for ACME Solar Holdings
| 1 Day | 5 Days | 1 Month | 6 Months | 1 Year | 5 Years |
|---|---|---|---|---|---|
| -1.15% | -3.20% | +2.90% | +54.09% | +45.25% | +63.52% |

 19
19







 Access Market Heat-map & Insights
  Create, Save & Share your Screener
  Use 200+ Screening Filters





