Gala Precision Engineering Files February 2026 Investor Presentation with Stock Exchanges


Gala Precision Engineering Limited filed its February 2026 investor presentation with BSE and NSE, showcasing its position as a leading precision components manufacturer. The company serves 175+ customers across renewable energy, industrial, and mobility sectors, with exports to 25+ countries contributing 37% of 9M-FY26 revenue. Financial performance shows revenue growth from INR 1,655 million in FY23 to INR 2,378 million in FY25, with EBITDA margins ranging from 16.07% to 19.16%. The presentation details manufacturing facilities in Maharashtra and Tamil Nadu, product portfolio of 750+ SKUs, and IPO proceeds utilization of INR 1,212.4 million across loan repayment, CAPEX, and corporate purposes.

*this image is generated using AI for illustrative purposes only.
Gala Precision Engineering Limited has submitted its investor presentation for February 2026 to BSE Limited and National Stock Exchange of India Limited as part of its general disclosure requirements. The presentation was filed on March 12, 2026, by Company Secretary and Compliance Officer Pooja Ladha.
Company Overview and Business Profile
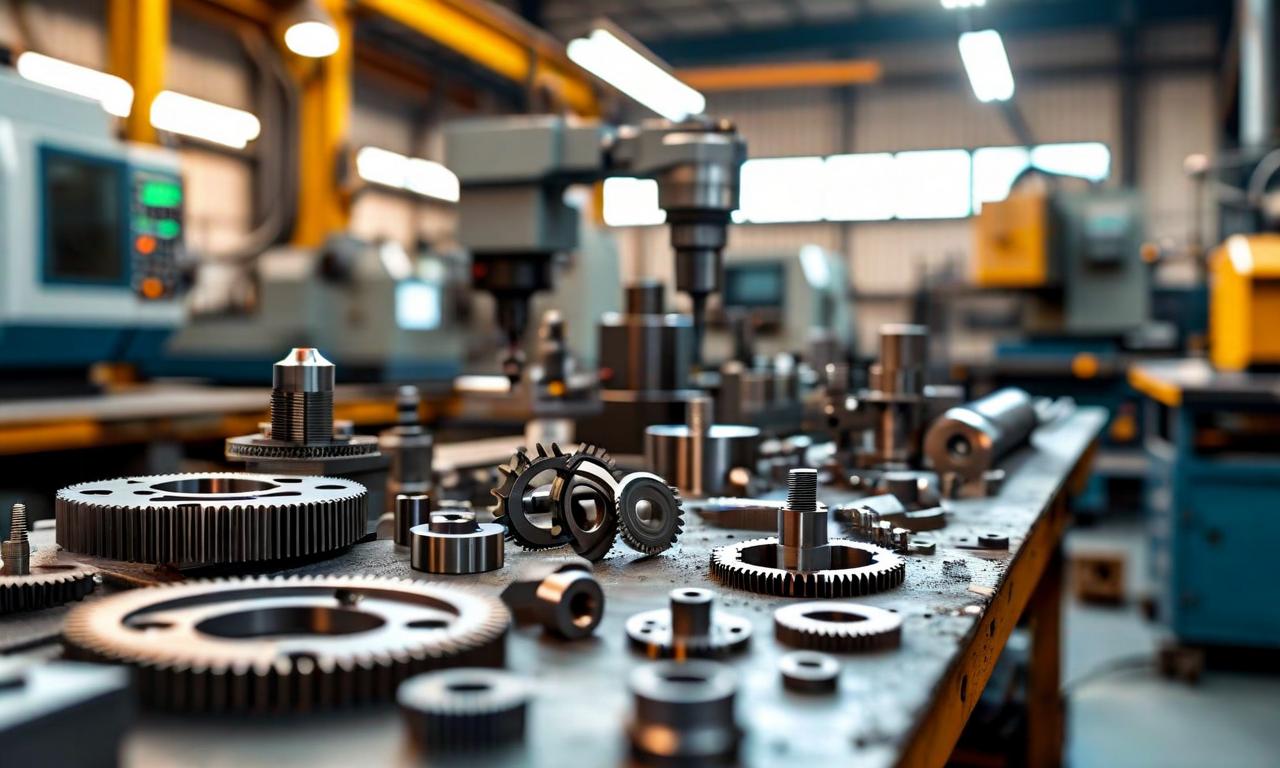
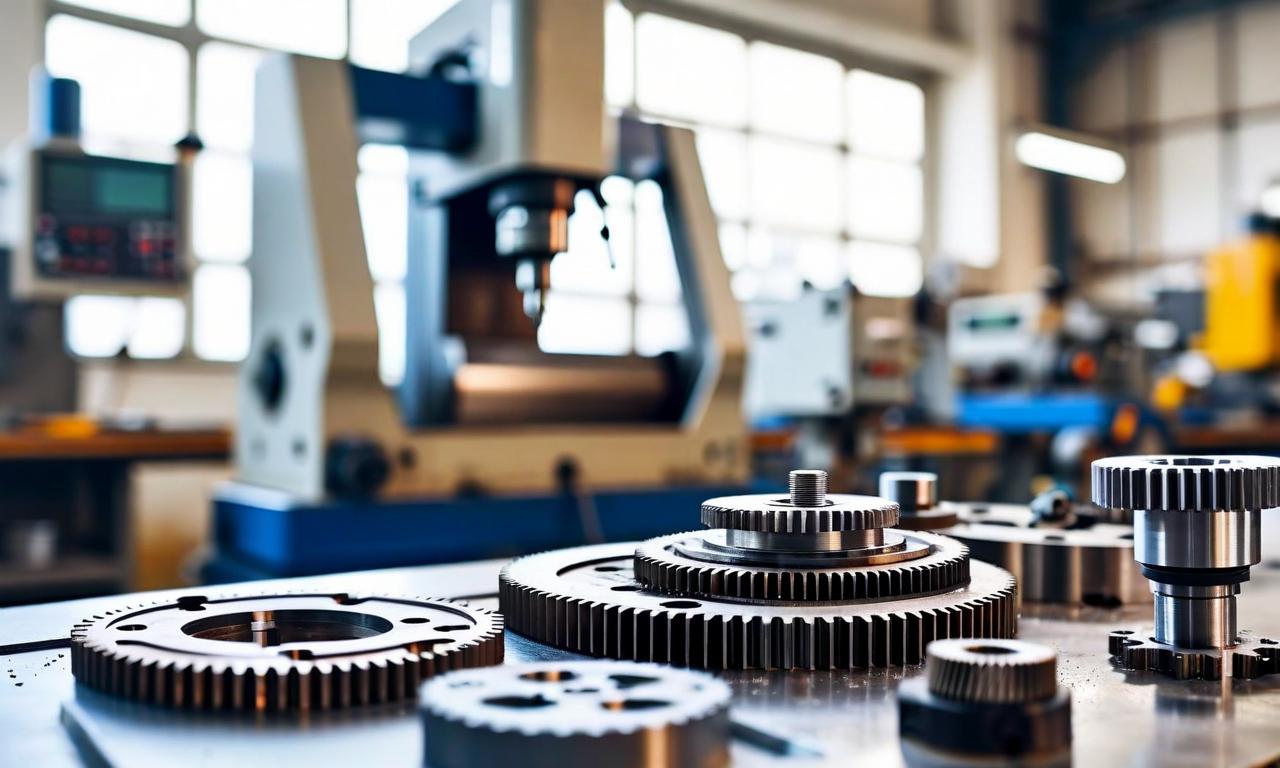
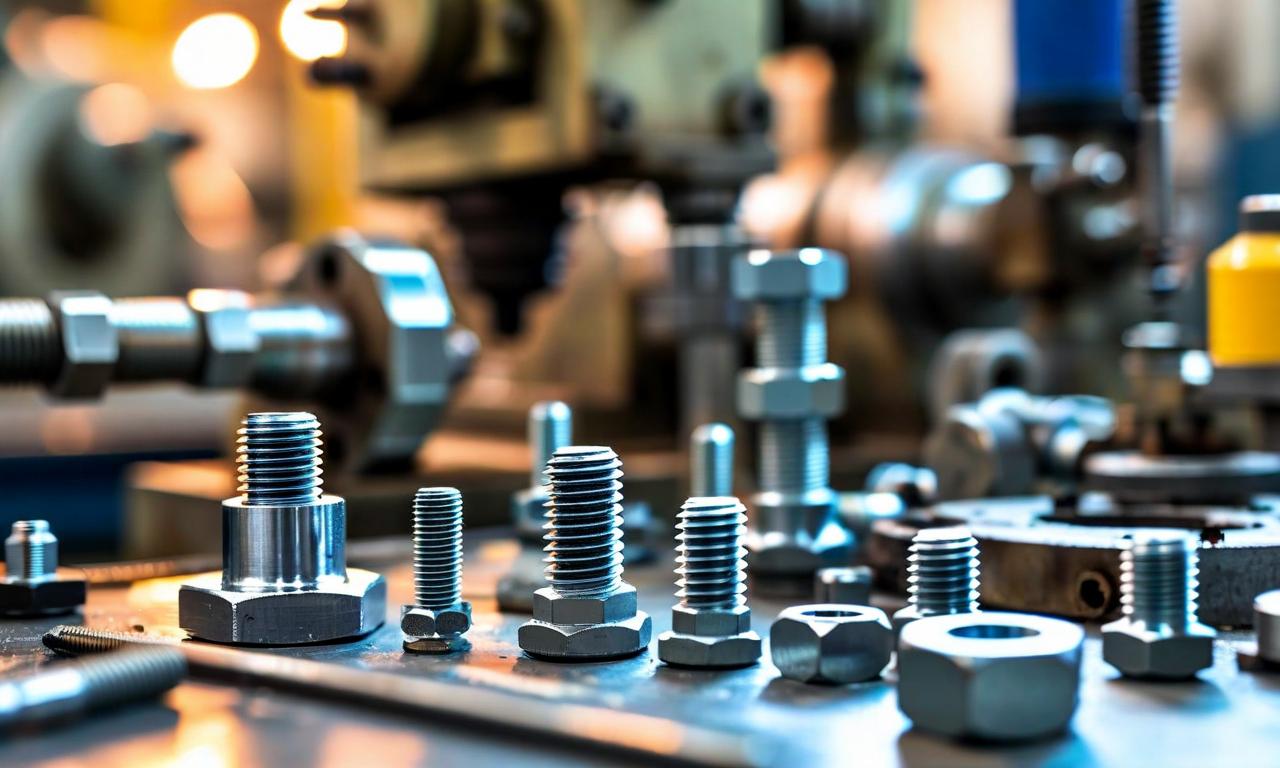
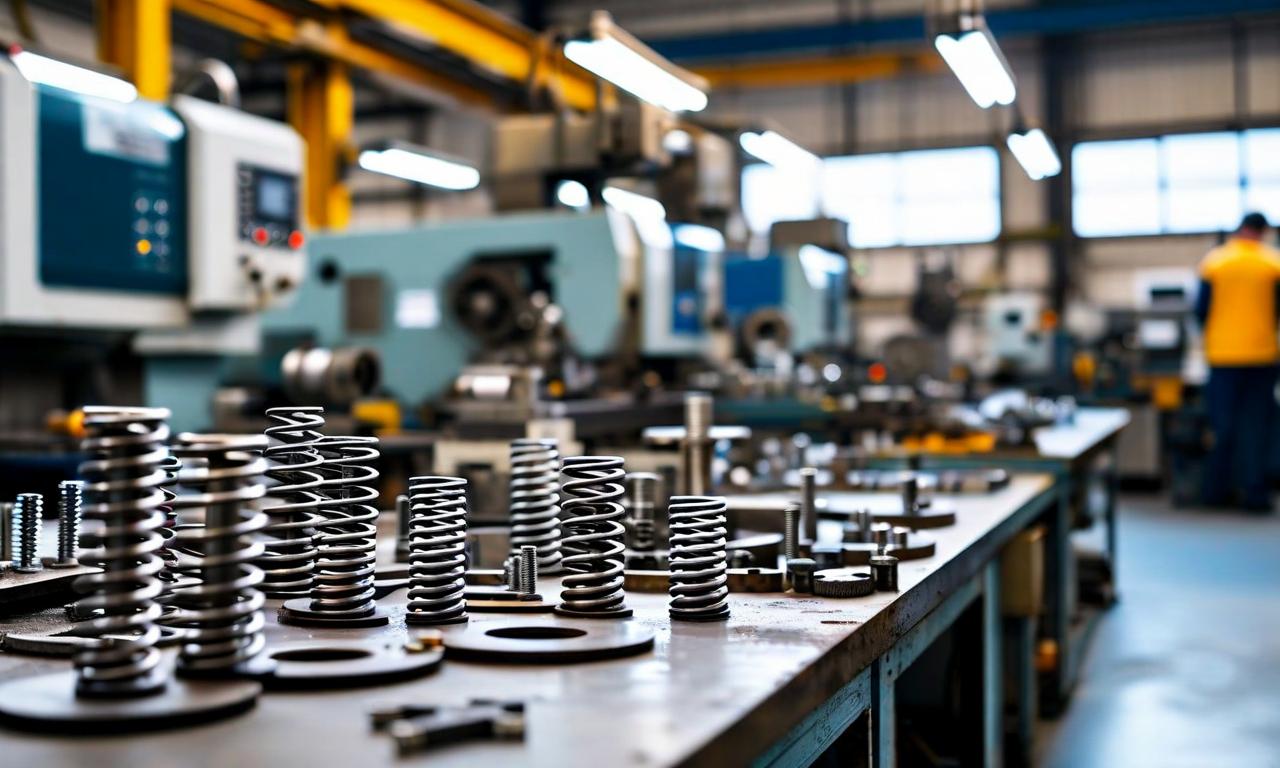
The company positions itself as a renowned manufacturer of precision components in India, supported by an experienced management team and diverse skilled workforce. Gala Precision Engineering specializes in manufacturing Special Fastening Solutions (SFS), Disc & Strip Springs (DSS), and Coil & Spiral Springs (CSS), offering an extensive portfolio of 750+ SKUs.
| Business Segment | Revenue Contribution (9M-FY26) |
|---|---|
| DSS | 48% |
| SFS | 35% |
| CSS | 17% |
The company serves a diversified customer base of more than 175 customers, including major OEMs, Tier-1 suppliers, and channel partners across renewable energy, industrial, and mobility sectors.
Global Operations and Market Presence
Gala Precision Engineering has established a significant international presence, exporting to more than 25 countries with an office in Frankfurt, Germany. Export revenues contributed 37% to total revenue in 9M-FY26. The company's end-user industries are distributed across renewable energy (41%), industrial (33%), and mobility (26%) sectors based on 9M-FY26 performance.
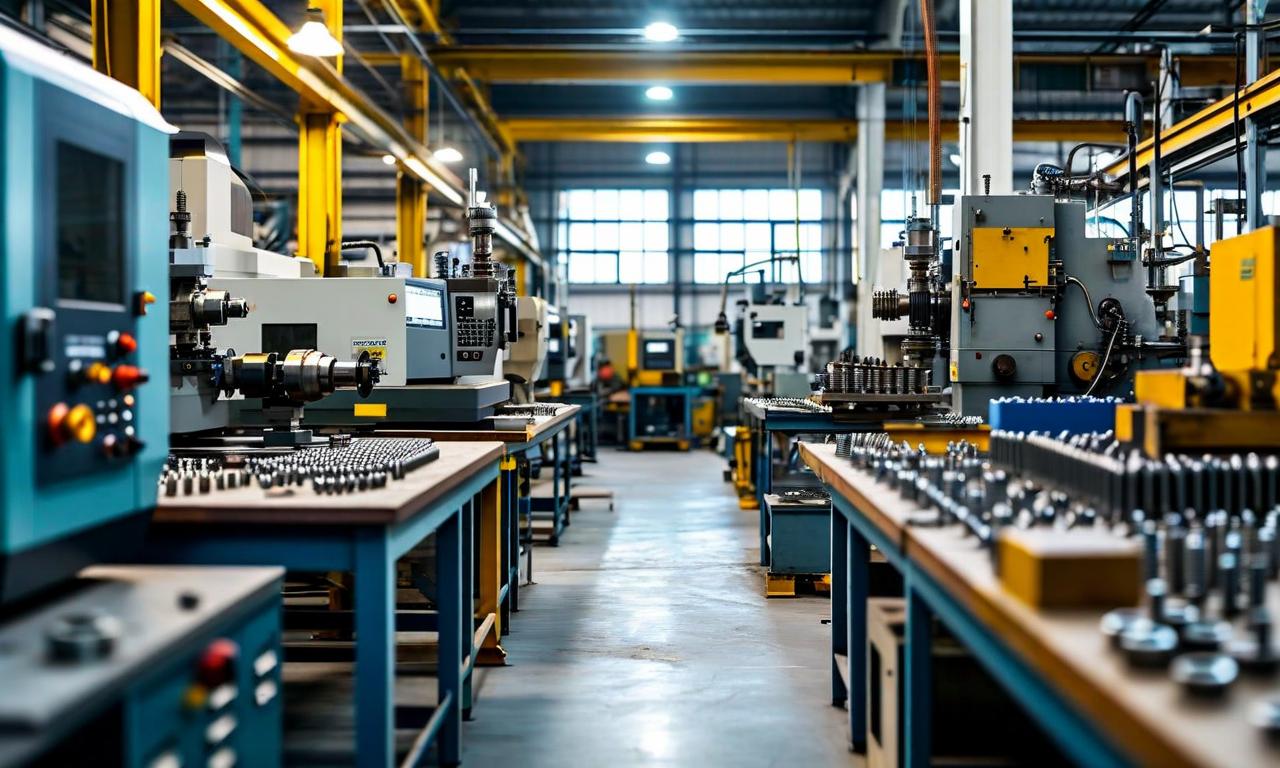
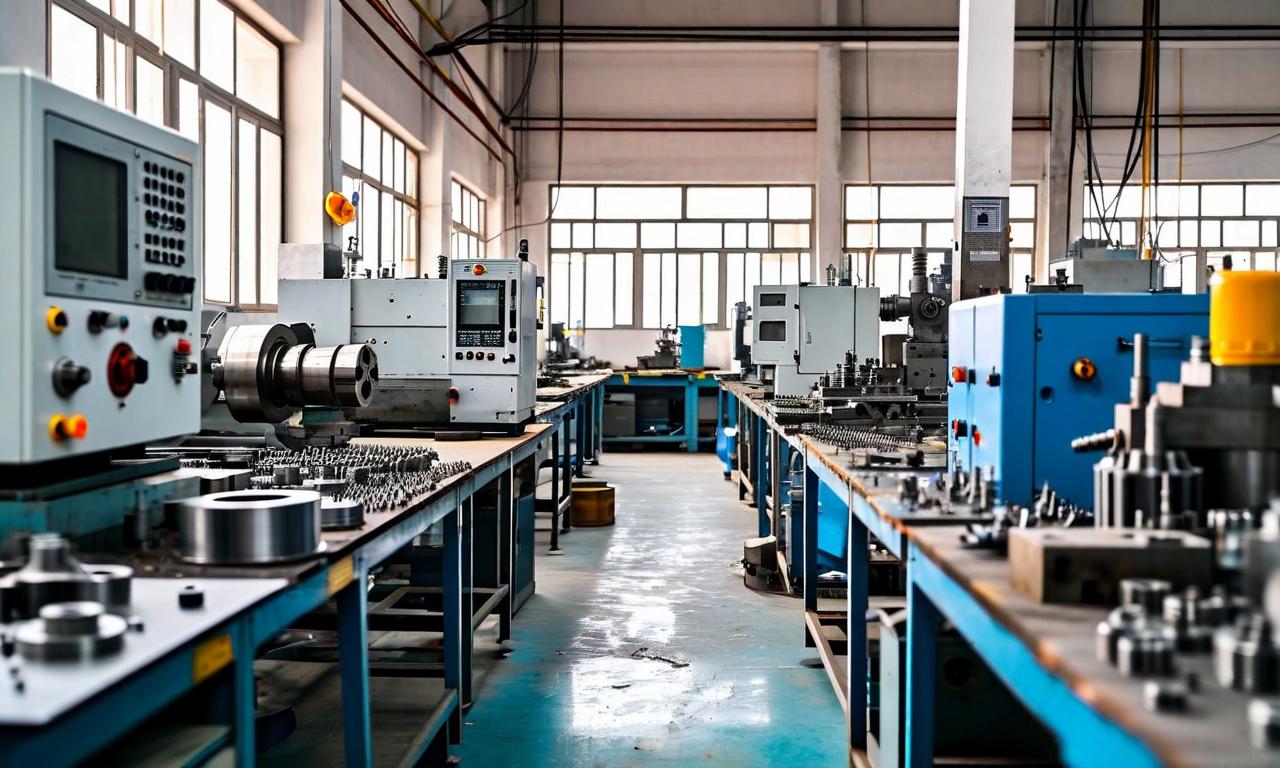
Manufacturing Infrastructure
The company operates state-of-the-art manufacturing facilities with in-house tool design and development capabilities:
| Facility | Location | Land Area |
|---|---|---|
| Wada Plant | Near Mumbai, Maharashtra | 28,800 Sq Mtrs |
| Vallam Plant | Near Chennai, Tamil Nadu | 6,718 Sq Mtrs |
Product Portfolio and Capacity Utilization
The presentation details capacity utilization across different product segments:
| Product Category | Installed Capacity | Utilization Rate | Revenue Contribution (FY25) |
|---|---|---|---|
| DSS | 225,517,000 units | 85% | 51% |
| CSS | 20,941,200 units | 78% | 21% |
| SFS | 420,000 units | 70% | - |
The company holds a 15% market share in the domestic specialized fastener solutions market for wind turbines.
Financial Performance Overview
The investor presentation includes consolidated financial statements showing the company's growth trajectory:
| Financial Metric (INR Mn) | FY23 | FY24 | FY25 | 9M-FY26 |
|---|---|---|---|---|
| Revenue from Operations | 1,655 | 2,025 | 2,378 | 2,197 |
| EBITDA | 274 | 388 | 408 | 353 |
| EBITDA Margin (%) | 16.56% | 19.16% | 17.16% | 16.07% |
| PAT before Exceptional Items | 144 | 246 | 271 | 244 |
| PAT Margin before Exceptional Items (%) | 8.70% | 12.15% | 11.40% | 11.11% |
Market Growth Projections
The presentation outlines market growth expectations across different product segments:
- DSS products: Domestic market CAGR of 6.0% (FY24-FY27E), Global market CAGR of 6.6% (CY24-CY26E)
- CSS products: Domestic market CAGR of 9.8% (FY24-FY27E), Global market CAGR of 6.7% (CY24-CY26E)
- SFS products: Domestic market CAGR of 18.0% (FY24-FY27E)
IPO Proceeds Utilization
The company provided an update on the deployment of IPO proceeds totaling INR 1,212.4 million:
| Purpose | Allocated Amount (INR Mn) | Utilized Amount (INR Mn) | Balance (INR Mn) |
|---|---|---|---|
| Loan Repayment | 454.3 | 454.3 | - |
| Chennai CAPEX | 370.0 | 254.8 | 124.2 |
| Wada CAPEX | 110.7 | 83.1 | 27.6 |
| General Corporate Purposes | 277.4 | 6.9 | 270.5 |
| Total | 1,212.4 | 790.1 | 422.3 |
The comprehensive investor presentation is available on the company's website at www.galagroup.com and serves as a detailed overview of the company's operations, financial performance, and strategic direction for stakeholders and investors.
Historical Stock Returns for Gala Precision Engineering
| 1 Day | 5 Days | 1 Month | 6 Months | 1 Year | 5 Years |
|---|---|---|---|---|---|
| +3.78% | -5.55% | -1.19% | +52.89% | +32.45% | +44.48% |
 17
17