Wanbury Q3FY26: Net Profit Surges 1194% YoY to ₹15.8 Crores, Revenue Up 21.7%


Wanbury Limited reported outstanding Q3FY26 financial performance with profit after tax jumping 1194% to ₹15.8 crores and revenue growth of 21.7% to ₹162.4 crores. The pharmaceutical company achieved significant EBITDA growth of 81.7% with margin expansion to 16.5%, supported by higher API volumes, improved capacity utilization, and operational efficiency gains across both API and formulations business segments.


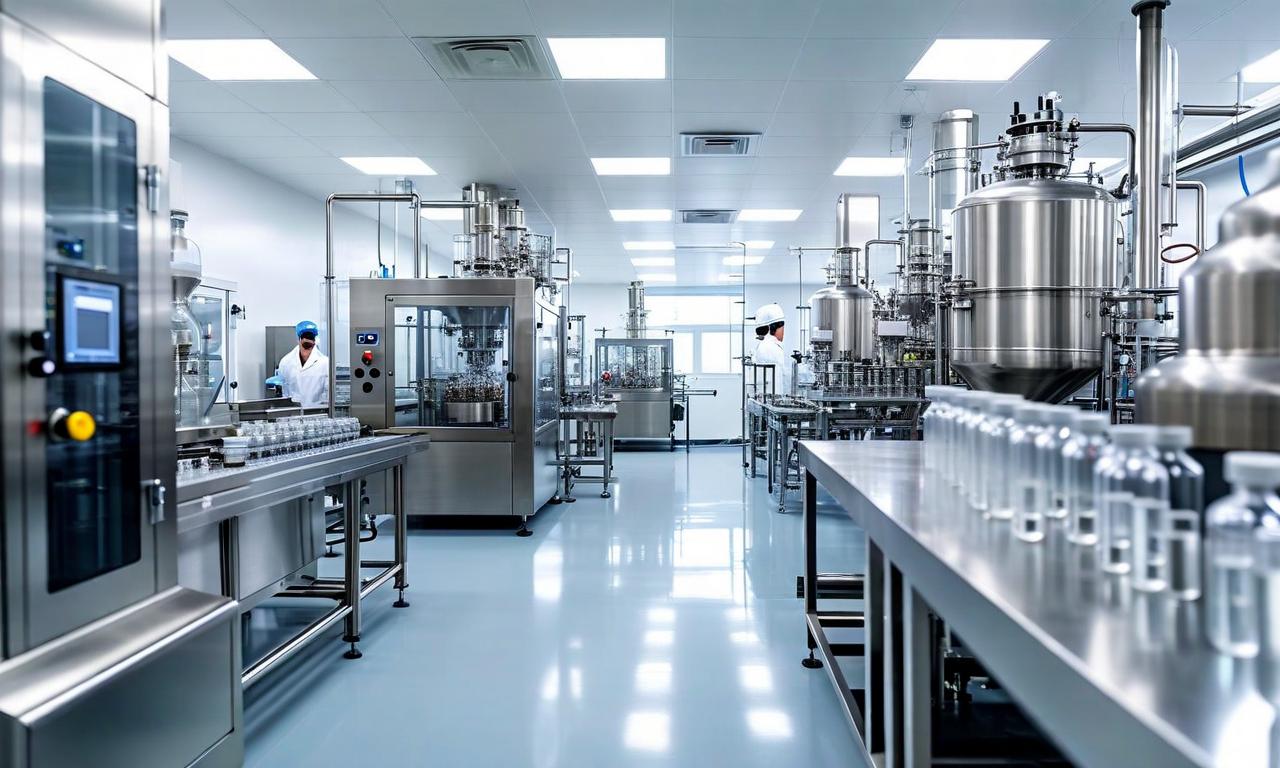
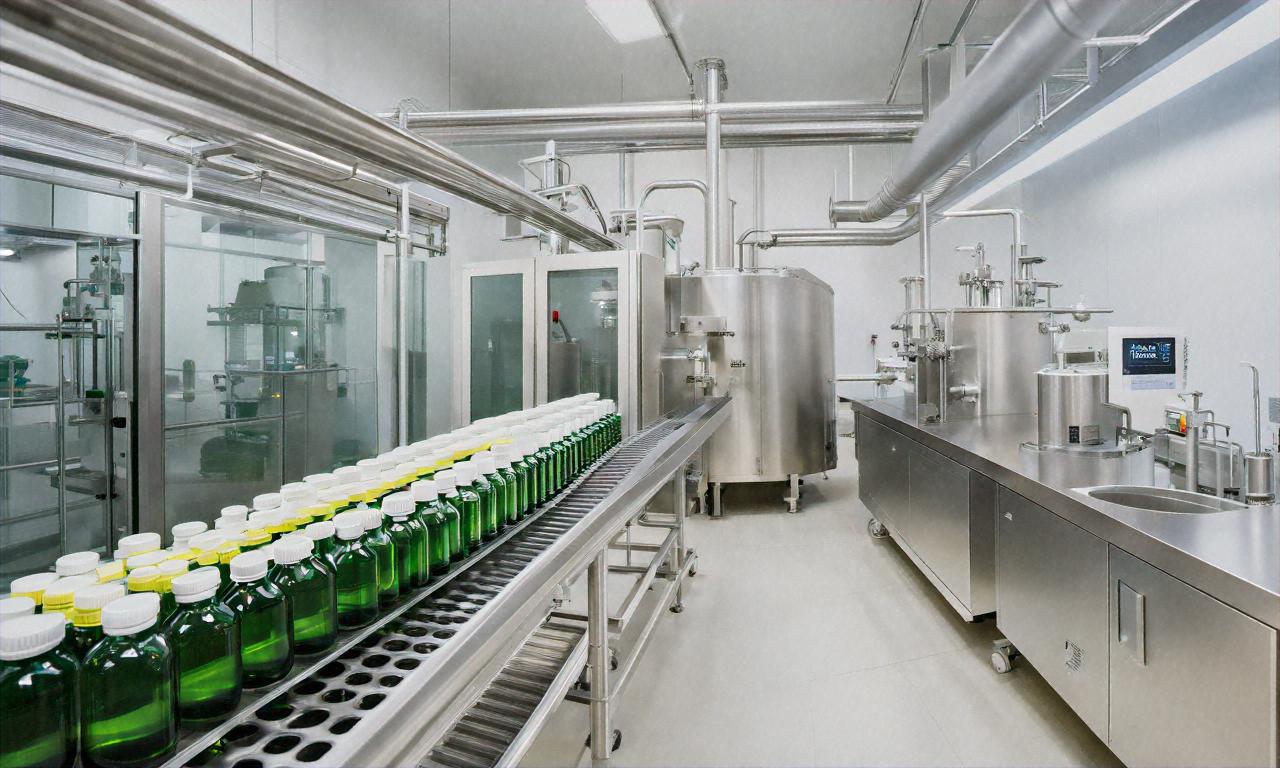
*this image is generated using AI for illustrative purposes only.
Wanbury Limited has delivered exceptional financial performance in Q3FY26 with net profit surging significantly compared to the previous year. The pharmaceutical company demonstrated remarkable operational efficiency and profitability improvement across key financial metrics, driven by higher API volumes and improved capacity utilization.
Outstanding Profitability Growth
The company achieved remarkable profitability improvement with profit after tax reaching ₹15.8 crores in Q3FY26 compared to ₹1.2 crores in Q3FY25, representing an impressive growth of 1194.3%. This exceptional performance reflects strong operating performance, margin expansion, improved cost efficiencies and lower finance costs.
| Profitability Metrics: | Q3FY26 | Q3FY25 | Growth (%) |
|---|---|---|---|
| Profit After Tax: | ₹15.8 crores | ₹1.2 crores | +1194.3% |
| Revenue from Operations: | ₹162.4 crores | ₹133.5 crores | +21.7% |
| PAT Margin: | 9.7% | 0.9% | +878 bps |
Revenue Performance and Growth
Revenue from operations showed strong growth momentum reaching ₹162.4 crores in Q3FY26 compared to ₹133.5 crores in Q3FY25, marking a year-on-year growth of 21.7%. This revenue expansion was driven by higher API volumes, improved capacity utilization at key manufacturing facilities and steady performance in the formulations business.
EBITDA Performance and Margin Expansion
The company demonstrated remarkable operational efficiency with EBITDA reaching ₹26.9 crores in Q3FY26 compared to ₹14.8 crores in Q3FY25, representing strong growth of 81.7%. The EBITDA margin expanded significantly to 16.5% from 11.0% year-on-year, led by operating leverage, better procurement strategies, higher product yields and enhanced solvent recovery systems.
| EBITDA Metrics: | Q3FY26 | Q3FY25 | Growth/Change |
|---|---|---|---|
| EBITDA: | ₹26.9 crores | ₹14.8 crores | +81.7% |
| EBITDA Margin: | 16.5% | 11.0% | +545 bps |
Nine-Month Performance Momentum
For the nine months ended December 31, 2025, Wanbury maintained strong momentum with profit after tax of ₹44.4 crores compared to ₹10.3 crores in the corresponding period, marking a substantial increase of 332.5%. Revenue from operations for the nine-month period stood at ₹485.7 crores versus ₹427.5 crores in the previous year, reflecting growth of 13.6%.
| Nine-Month Performance: | 9MFY26 | 9MFY25 | Change (%) |
|---|---|---|---|
| Revenue from Operations: | ₹485.7 crores | ₹427.5 crores | +13.6% |
| Profit After Tax: | ₹44.4 crores | ₹10.3 crores | +332.5% |
| EBITDA: | ₹77.6 crores | ₹48.3 crores | +60.6% |
| EBITDA Margin: | 16.0% | 11.3% | +467 bps |
Business Highlights and Strategic Developments
According to Mr. Mohan Rayana, Director of Wanbury Ltd., the company achieved commercial invoicing and shipment to European customers for high potent anaesthetic API from its cutting-edge Tanaku facility in Q3FY26. The company is well positioned for growth with upcoming new product launches including Antidiabetic, Anticoagulant, Cough suppressant and Antidepressant products. The formulations business remained EBITDA positive with good results from the recent launch of nutritional supplement C-Red and other products.
Manufacturing Infrastructure and Capabilities
The company operates two USFDA approved API facilities with 386 KL cumulative reactor capacity and has achieved highest-ever operational EBITDA of ₹80 crore. The API business maintains 80%+ export top line with emphasis on developed markets including EU, Brazil and US. The formulations business is rebuilding legacy brand formulations in India with 10+ active brands across key therapeutic categories such as Anti cold & cough, Anti-infective, Anti-inflammatory, Supplements and Orthopaedic segments.
| Business Segments: | Revenue Details |
|---|---|
| API Business: | ₹530 crore+ FY25 Revenue, ₹424 crore+ 9MFY26 Revenue |
| Formulations Business: | ₹70 crore+ FY25 Revenue, ₹62 crore+ 9MFY26 Revenue |
| Revenue Mix: | 88% API, 12% Formulations |
| Export Focus: | 80% Exports, 20% Domestic |
Historical Stock Returns for Wanbury
| 1 Day | 5 Days | 1 Month | 6 Months | 1 Year | 5 Years |
|---|---|---|---|---|---|
| +2.60% | +23.63% | +28.95% | +56.90% | +24.17% | +298.09% |
 20
20