Visaka Industries Reports Reduced Q2 Loss and Revenue Growth


Visaka Industries Limited reported a consolidated net loss of ₹87.00 million in Q2, an improvement from ₹166.00 million loss in the same period last year. Revenue increased by 5.52% year-over-year to ₹3,250.00 million. The building products segment generated ₹26,640.79 million, while synthetic yarn contributed ₹5,855.29 million. Total assets stood at ₹139,945.28 million, with total equity of ₹78,450.22 million. The company sold land in Ahmedabad, resulting in a profit of ₹3,674.30 million reported as an exceptional item.
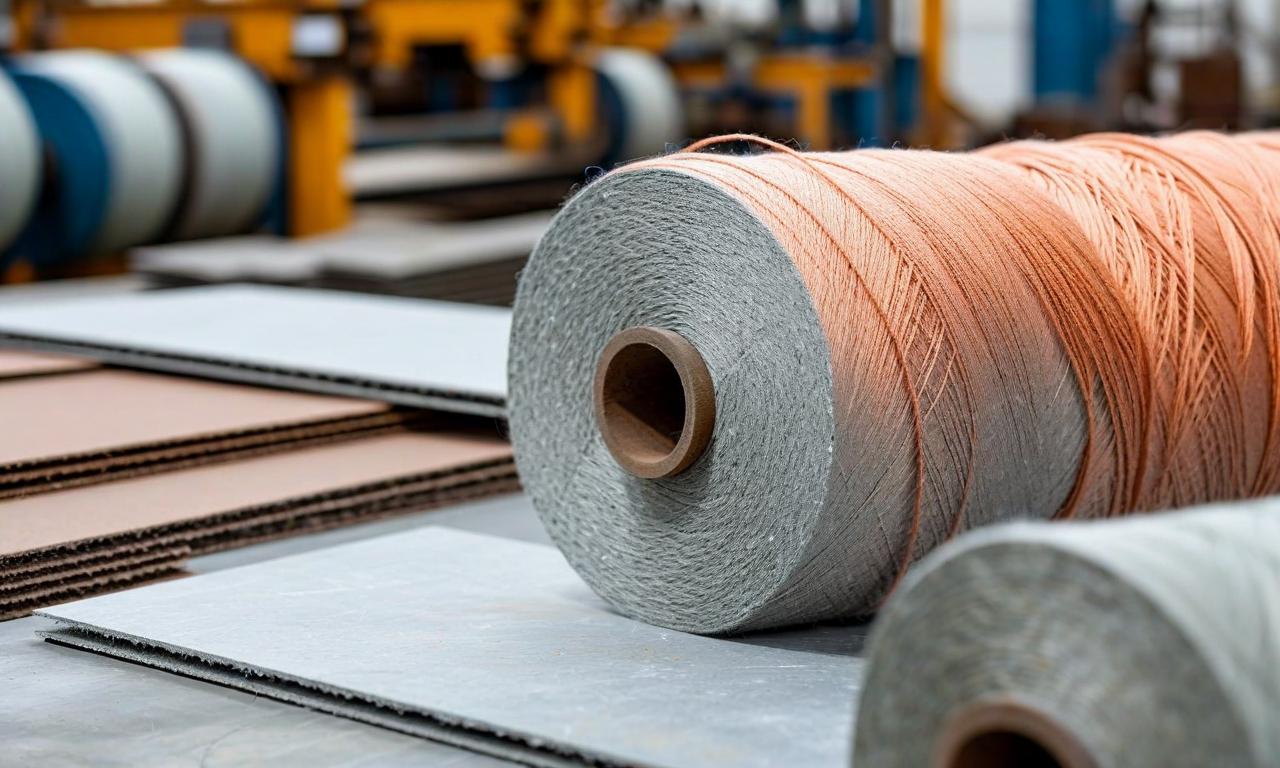

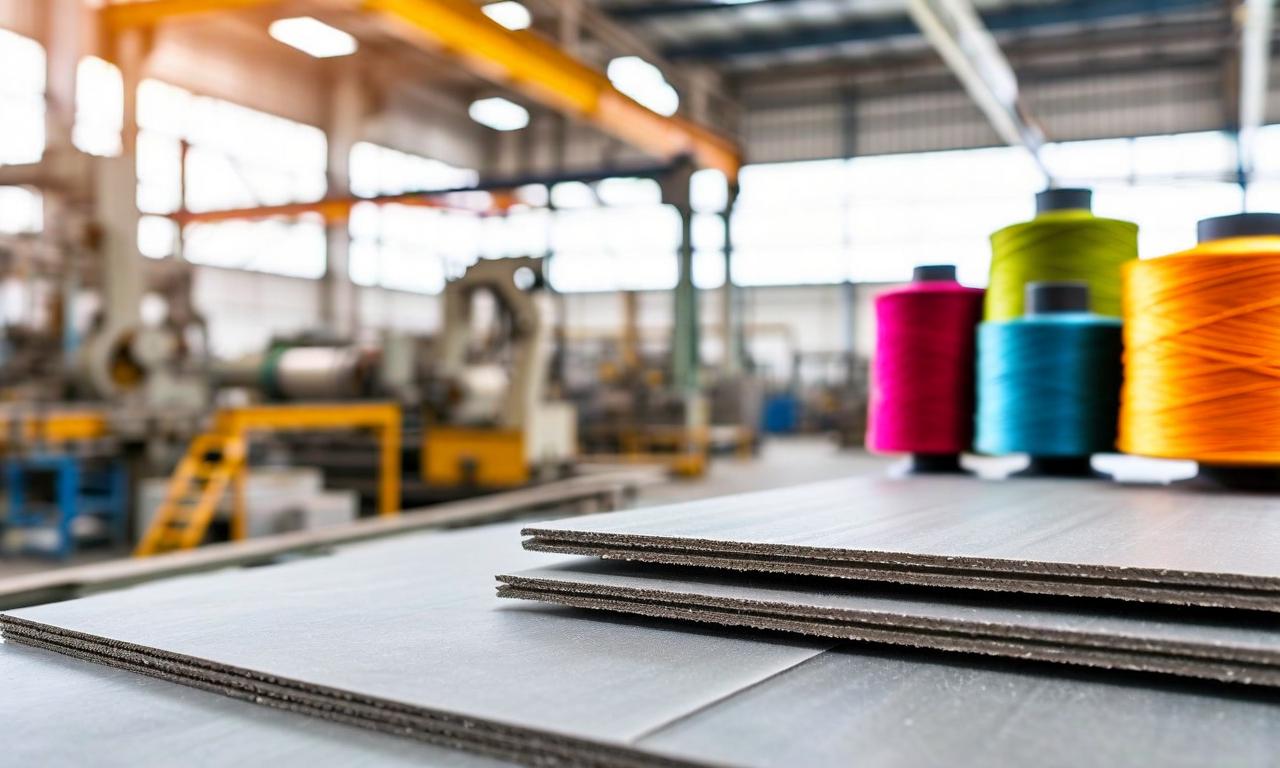
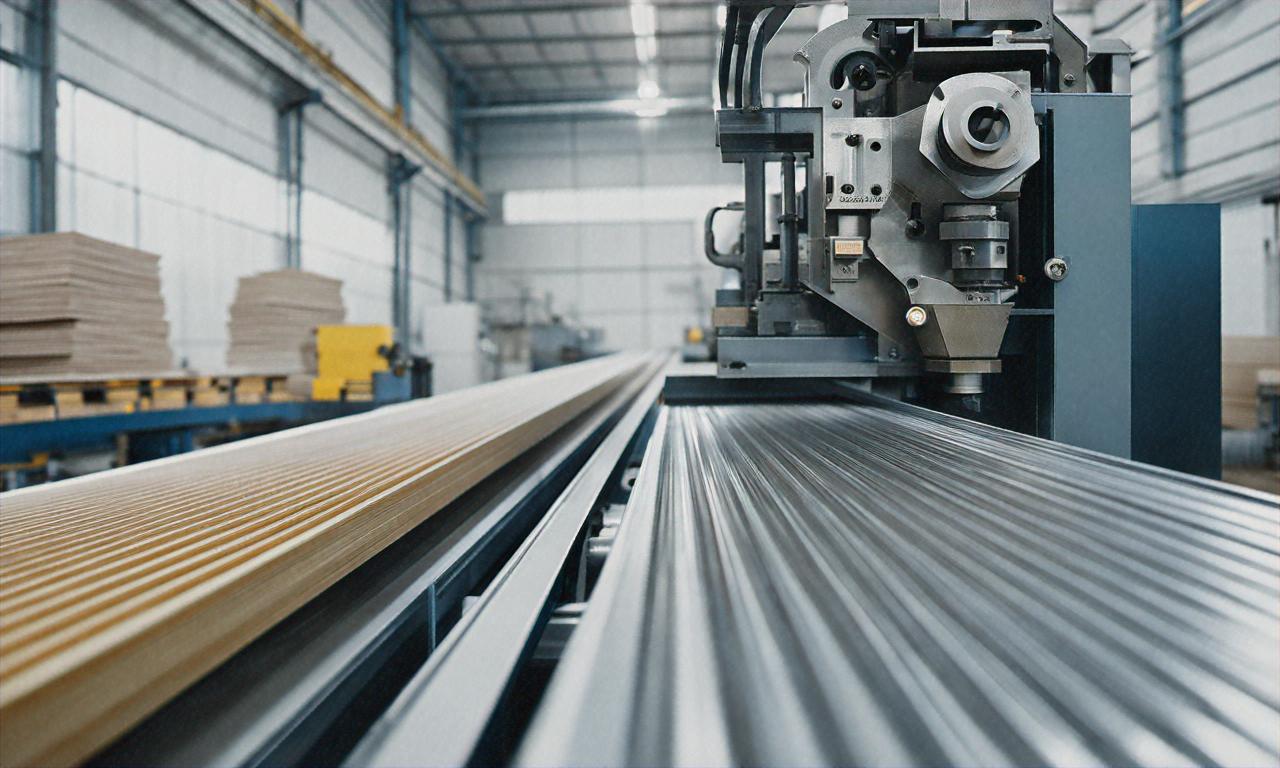
*this image is generated using AI for illustrative purposes only.
Visaka Industries Limited , a prominent player in the building products and synthetic yarn sectors, has reported its financial results for the second quarter, showing signs of improvement despite ongoing challenges.
Financial Performance
The company posted a consolidated net loss of ₹87.00 million in Q2, marking a significant improvement from the ₹166.00 million loss recorded in the same period last year. This reduction in losses indicates the company's efforts towards financial recovery are gaining traction.
Concurrently, Visaka Industries saw an uptick in its quarterly revenue, which increased to ₹3,250.00 million, up from ₹3,080.00 million in the corresponding quarter of the previous year. This 5.52% year-over-year growth in revenue suggests a gradual strengthening of the company's market position and demand for its products.
Segment Performance
The company's financial results reveal insights into its two main business segments:
Building Products: This segment, which includes products like fiber cement boards and panels, generated revenue of ₹26,640.79 million in Q2. It remains the primary revenue driver for Visaka Industries.
Synthetic Yarn: The synthetic yarn segment contributed ₹5,855.29 million to the quarterly revenue, indicating its significant role in the company's product portfolio.
Balance Sheet and Cash Flow
As of September 30, Visaka Industries reported:
- Total assets of ₹139,945.28 million
- Total equity of ₹78,450.22 million
- Cash and cash equivalents of ₹948.50 million
The company's cash flow statement indicates a net decrease in cash and cash equivalents of ₹673.76 million for the half-year ended September 30.
Strategic Developments
Notably, Visaka Industries sold land situated in Ahmedabad, Gujarat during this period. The profit from this sale, amounting to ₹3,674.30 million, was reported as an exceptional item, potentially contributing to the company's improved financial position.
Outlook
While Visaka Industries continues to face challenges, as evidenced by the quarterly loss, the reduction in net loss and growth in revenue suggest that the company's strategic initiatives may be starting to yield positive results. The building products segment remains crucial to the company's performance, and investors will likely be watching closely to see if this trend of improvement continues in the coming quarters.
As always, stakeholders should consider these results in the context of broader market conditions and the company's long-term strategies when making investment decisions.
Historical Stock Returns for Visaka Industries
| 1 Day | 5 Days | 1 Month | 6 Months | 1 Year | 5 Years |
|---|---|---|---|---|---|
| +2.80% | +9.87% | +10.97% | +40.30% | +4.17% | -48.55% |
 19
19