Sundaram Brake Linings Reports Q3 FY26 Net Loss of ₹124.32 Lacs in Regulatory Filing


Sundaram Brake Linings filed its Q3 FY26 results showing a net loss of ₹124.32 lacs compared to a profit of ₹88.86 lacs in Q3 FY25, with revenue declining to ₹8,418.64 lacs. The company also reported an exceptional charge of ₹33.02 lacs due to new labour codes and filed the results with stock exchanges under regulatory compliance.
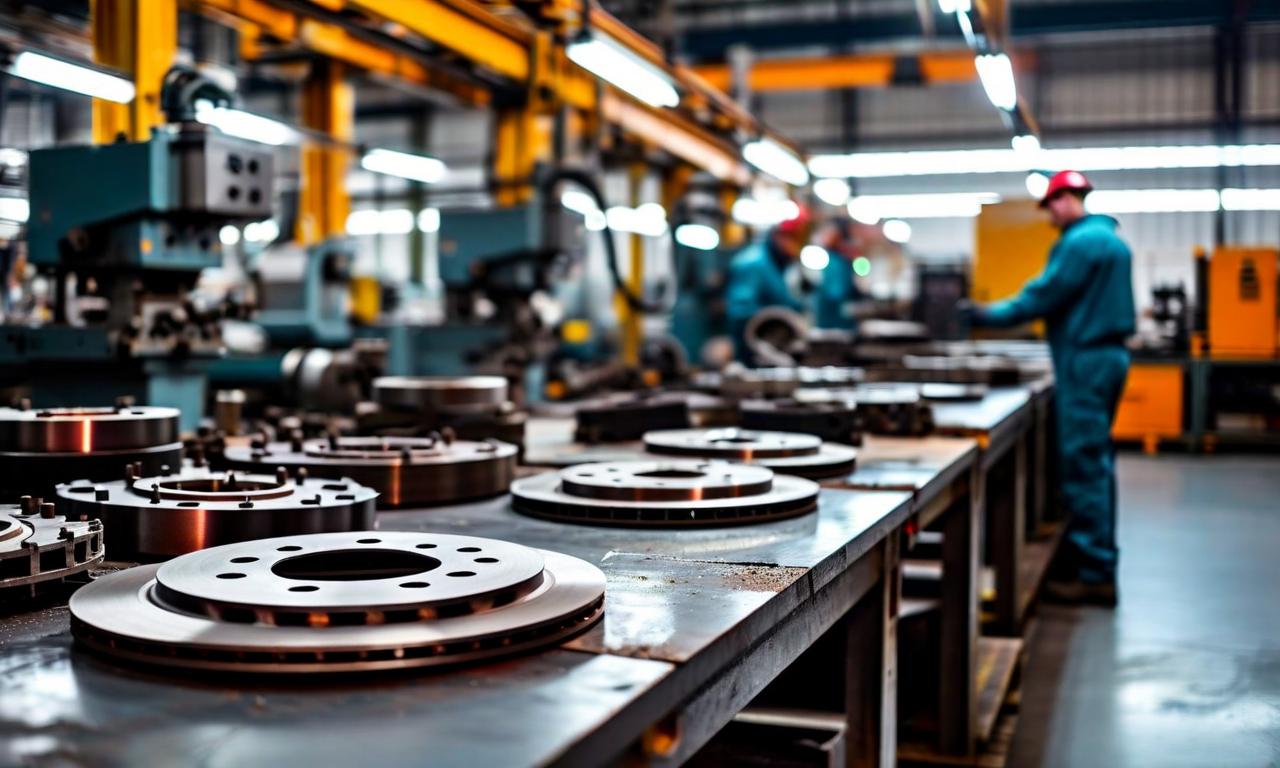

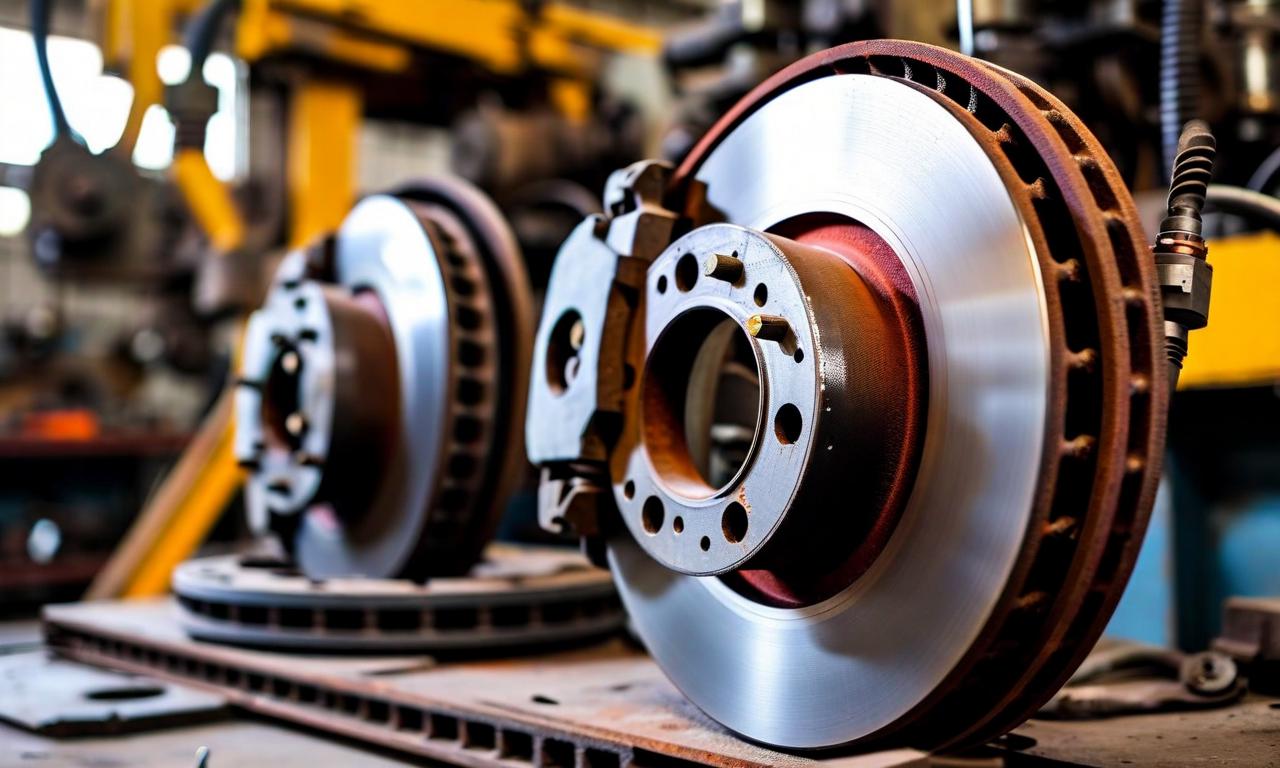
*this image is generated using AI for illustrative purposes only.
Sundaram Brake Linings Limited announced its unaudited financial results for the quarter and nine months ended December 31, 2025, through a regulatory filing under Regulation 33 of SEBI (Listing Obligations and Disclosure Requirements) Regulations, 2015. The Chennai-based friction materials manufacturer reported a significant decline in profitability, moving from profit to loss during the third quarter compared to the corresponding period last year.
Quarterly Financial Performance
The company's financial performance for Q3 FY26 showed considerable weakness across key metrics. Revenue from operations declined year-on-year, while the company moved from profitability to substantial losses during the quarter.
| Metric | Q3 FY26 | Q3 FY25 | Change |
|---|---|---|---|
| Revenue from Operations | ₹8,418.64 lacs | ₹8,830.29 lacs | -4.66% |
| Total Revenue | ₹8,450.89 lacs | ₹8,930.10 lacs | -5.36% |
| Net Profit/(Loss) | (₹124.32 lacs) | ₹88.86 lacs | Loss |
| Earnings Per Share | (₹3.16) | ₹2.26 | Negative |
Other income for the quarter stood at ₹32.25 lacs compared to ₹99.81 lacs in Q3 FY25, representing a significant decline of 67.69%.
Nine-Month Performance Analysis
The nine-month period ending December 31, 2025, reflected similar challenges with the company recording substantial losses compared to the profitable performance in the corresponding period of the previous year.
| Parameter | 9M FY26 | 9M FY25 | Variance |
|---|---|---|---|
| Revenue from Operations | ₹25,422.02 lacs | ₹25,525.60 lacs | -0.41% |
| Total Revenue | ₹25,658.14 lacs | ₹25,717.89 lacs | -0.23% |
| Net Profit/(Loss) | (₹489.98 lacs) | ₹384.84 lacs | Loss |
| Earnings Per Share | (₹12.45) | ₹9.78 | Negative |
Cost Structure and Operational Challenges
The company's expense structure showed mixed trends during Q3 FY26. Cost of materials consumed decreased to ₹4,056.97 lacs from ₹4,391.38 lacs in Q3 FY25. However, changes in inventories of finished goods and work-in-progress resulted in an expense of ₹341.48 lacs compared to a benefit of ₹33.68 lacs in the previous year.
Employee benefits expenses remained relatively stable at ₹1,273.82 lacs compared to ₹1,379.21 lacs in Q3 FY25. Finance costs declined to ₹74.74 lacs from ₹112.88 lacs, while other expenses decreased to ₹2,655.30 lacs from ₹2,823.56 lacs year-on-year.
Impact of New Labour Codes
The company recognized an exceptional item of ₹33.02 lacs in Q3 FY26 related to the impact of new labour codes that became effective from November 21, 2025. The Government of India consolidated 29 existing labour legislations into four unified Labour codes. Based on management's assessment, the company considered an incremental gratuity liability arising from these new codes.
Regulatory Compliance and Board Approval
The Board of Directors approved the unaudited financial results at their meeting held on February 6, 2026, which commenced at 10.40 AM and concluded at 11.20 AM. The results were reviewed by the Audit Committee and received an unqualified limited review report from statutory auditors Brahmayya & Co. The company filed the results with both NSE (Scrip Code: SUNDRMRAK) and BSE (Scrip Code: 590072) under the regulatory requirements.
| Corporate Details | Information |
|---|---|
| Paid-up Equity Share Capital | ₹393.46 lacs |
| Face Value per Share | ₹10 |
| CIN | L34300TN1974PLC006703 |
| Registered Office | Padi, Chennai - 600 050 |
The company secretary and compliance officer J. R. Vishnu Varthan signed the regulatory filing, confirming compliance with SEBI listing regulations.
Historical Stock Returns for Sundaram Brake Linings
| 1 Day | 5 Days | 1 Month | 6 Months | 1 Year | 5 Years |
|---|---|---|---|---|---|
| -0.47% | -6.75% | -5.94% | +32.62% | -3.91% | +79.55% |
 18
18