Steel Strips Wheels Reports Record January Revenue of ₹480.03 Crore, Up 17.32% YoY


Steel Strips Wheels achieved its highest ever monthly performance in January 2026 with net turnover of ₹480.03 crore, marking 17.32% year-over-year growth. The company recorded exceptional segment-wise performance with aluminum and tractor divisions posting 25% growth each, while the 2&3 wheeler segment surged 55% by value, building on strong Q3 FY26 results.

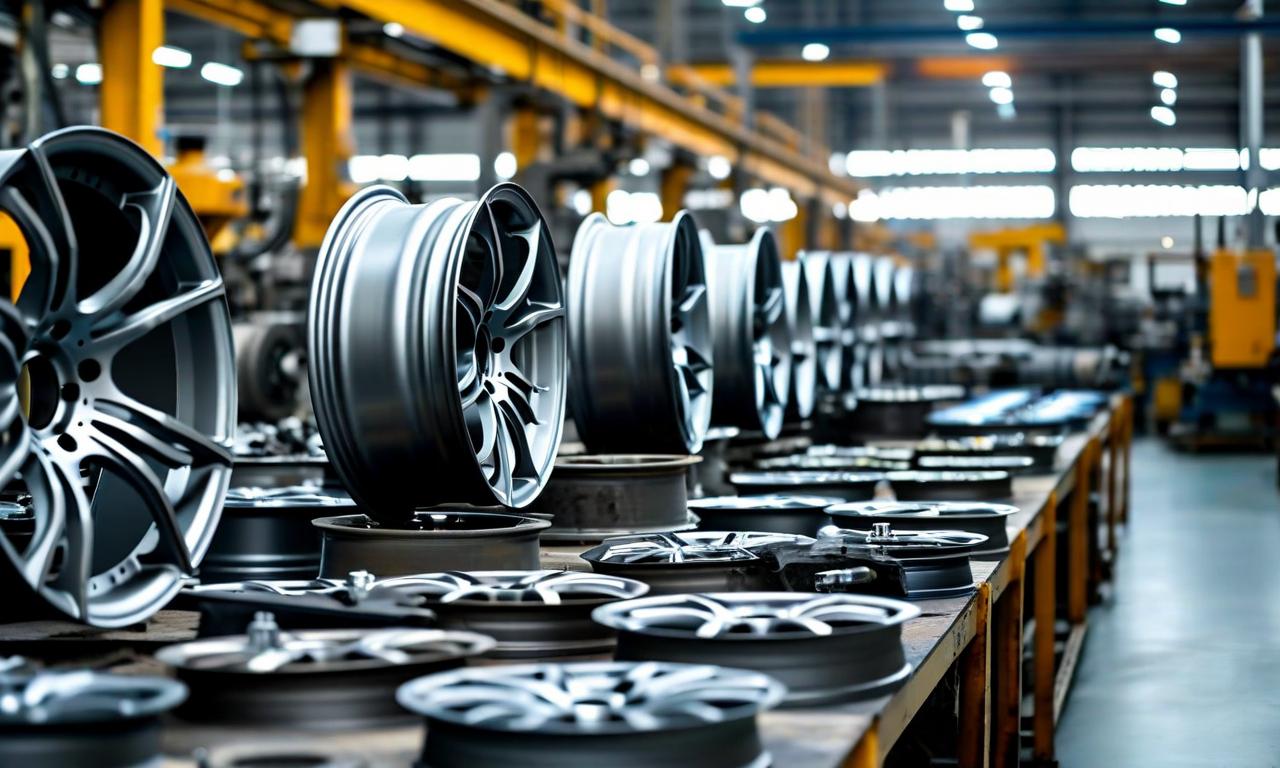
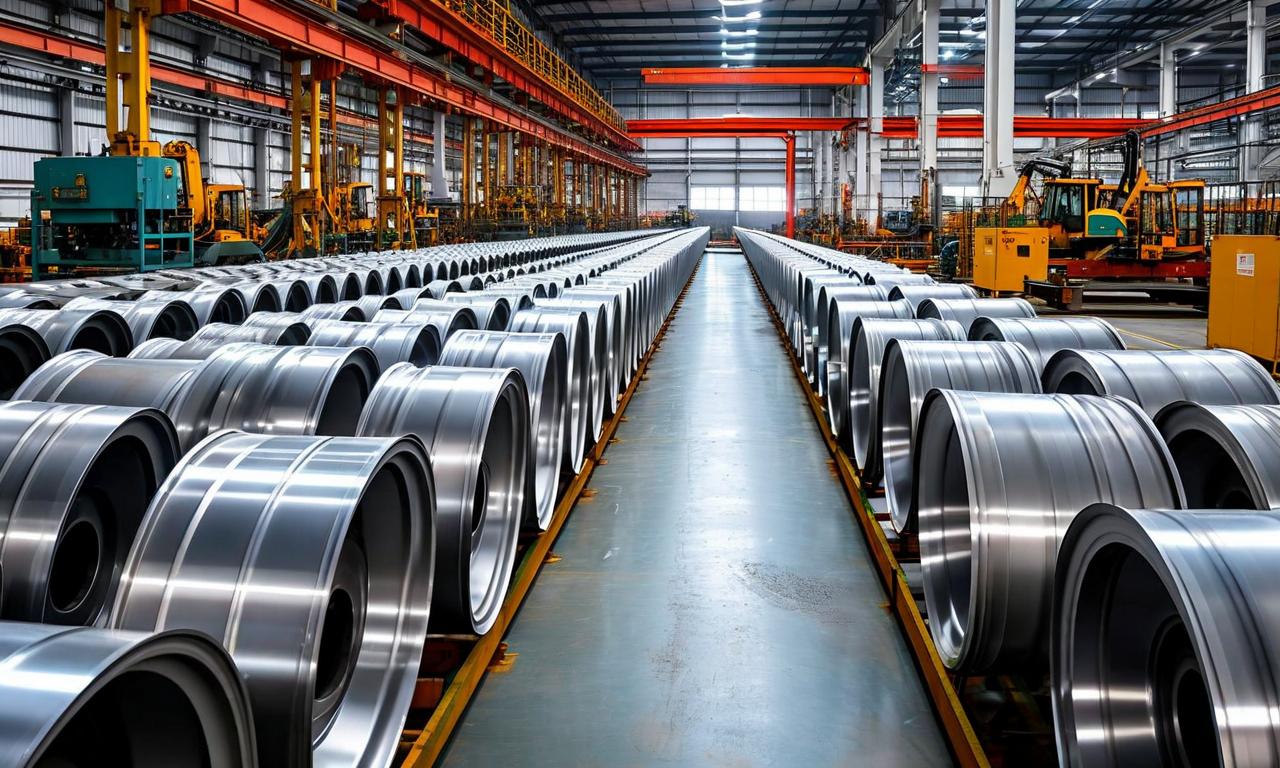
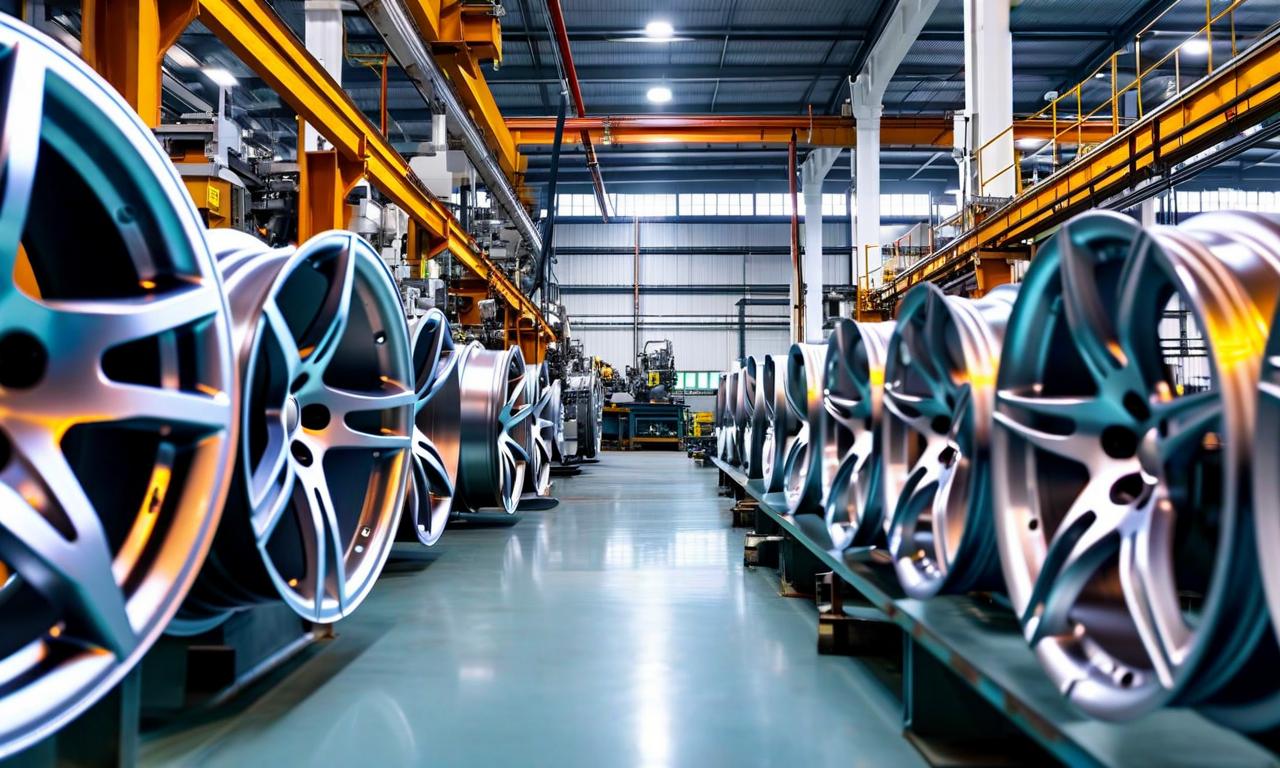
*this image is generated using AI for illustrative purposes only.
Steel Strips Wheels Limited achieved its highest ever monthly net turnover of ₹480.03 crore in January 2026, marking a robust yearly growth of 17.32%. The company also recorded its highest ever monthly units sold during the month, demonstrating strong momentum across key business segments with aluminum and tractor divisions leading the growth trajectory.
Record January 2026 Performance
The company's exceptional performance was driven by significant growth across multiple segments, with net turnover reaching ₹480.03 crore compared to ₹409.16 crore in January 2025. Gross turnover stood at ₹556.19 crore, reflecting an 11.14% year-over-year increase.
| Financial Metric | January 2026 | January 2025 | Growth (%) |
|---|---|---|---|
| Net Turnover | ₹480.03 Cr | ₹409.16 Cr | +17.32% |
| Gross Turnover | ₹556.19 Cr | ₹500.42 Cr | +11.14% |
Segment-Wise Performance Analysis
The aluminum segment achieved its highest ever monthly sales with 25% growth by value and 19% growth by volume year-over-year. The tractor segment also recorded its highest ever monthly sales, posting 25% growth by value and 26% growth by volume. The 2 & 3 wheeler segment demonstrated exceptional performance with 55% value growth and 49% volume growth.
| Segment | Value Growth (YoY) | Volume Growth (YoY) | Performance Highlight |
|---|---|---|---|
| 2 & 3 Wheeler | +55% | +49% | Robust volume growth |
| Aluminum Segment | +25% | +19% | Highest Ever Monthly Sales |
| Tractor | +25% | +26% | Highest Ever Monthly Sales |
| Truck | +20% | +20% | Highest Ever Domestic Sales in CV |
| Passenger Car (Steel) | -19% | -17% | Impacted by mix change |
| Exports (Overall) | -52% | -68% | Challenging export conditions |
Strong Q3 FY26 Foundation
The record January performance builds upon the company's impressive Q3 FY26 results, which showcased significant revenue growth despite challenging export market conditions. The quarterly results highlighted the strength of the company's market positioning with sustained domestic demand momentum.
| Financial Metric | Q3 FY26 | Q3 FY25 | Growth (%) |
|---|---|---|---|
| Revenue | Rs 1,321 crores | Rs 1,075 crores | +23% |
| EBITDA | Rs 128 crores | Rs 118 crores | +8% |
| EBITDA per wheel | Rs 260 | Rs 240 | +8.3% |
Commercial Vehicle and Premium Segments Drive Growth
The truck segment achieved its highest ever domestic monthly sales in the commercial vehicle category, recording 20% growth both by value and volume. The aluminum segment's exceptional performance reinforces its position as a key growth driver, benefiting from the company's successful premiumization strategy where alloy wheels contribute approximately 37% to total revenue while representing 20% in volume terms.
Capacity Expansion Progress
The company continues its Rs 420 crores CAPEX investment in Bhuj, utilizing the acquired AMW facility infrastructure. This strategic expansion will significantly enhance capacity across aluminum wheels and knuckles segments, with commercial production targeted for December 2026.
| Expansion Details | Specifications |
|---|---|
| Total Investment | Rs 420 crores |
| Aluminum Wheels Capacity | 1.2 million units |
| Aluminum Knuckles Capacity | 0.6 million units |
| Expected Peak Revenue | Rs 600-700 crores (wheels) + Rs 200 crores (knuckles) |
The record January performance reinforces the company's strong market position and growth momentum, with management maintaining confidence in achieving the Rs 6,000 crores revenue target for FY27 from existing assets.
Historical Stock Returns for Steel Strips Wheels
| 1 Day | 5 Days | 1 Month | 6 Months | 1 Year | 5 Years |
|---|---|---|---|---|---|
| -0.14% | +6.23% | +27.90% | +51.86% | +26.01% | +130.62% |
 19
19