Steel Exchange India Limited Reports Q3FY26 Results with Revenue Decline


Steel Exchange India Limited announced Q3FY26 financial results showing significant declines across key metrics. Revenue from operations dropped 26.60% to ₹24,035.05 lakhs while net profit plummeted 85.60% to ₹227.90 lakhs compared to the previous year. The company's steel and power segments both experienced revenue contractions, with operating margins compressing from 12% to 9%.

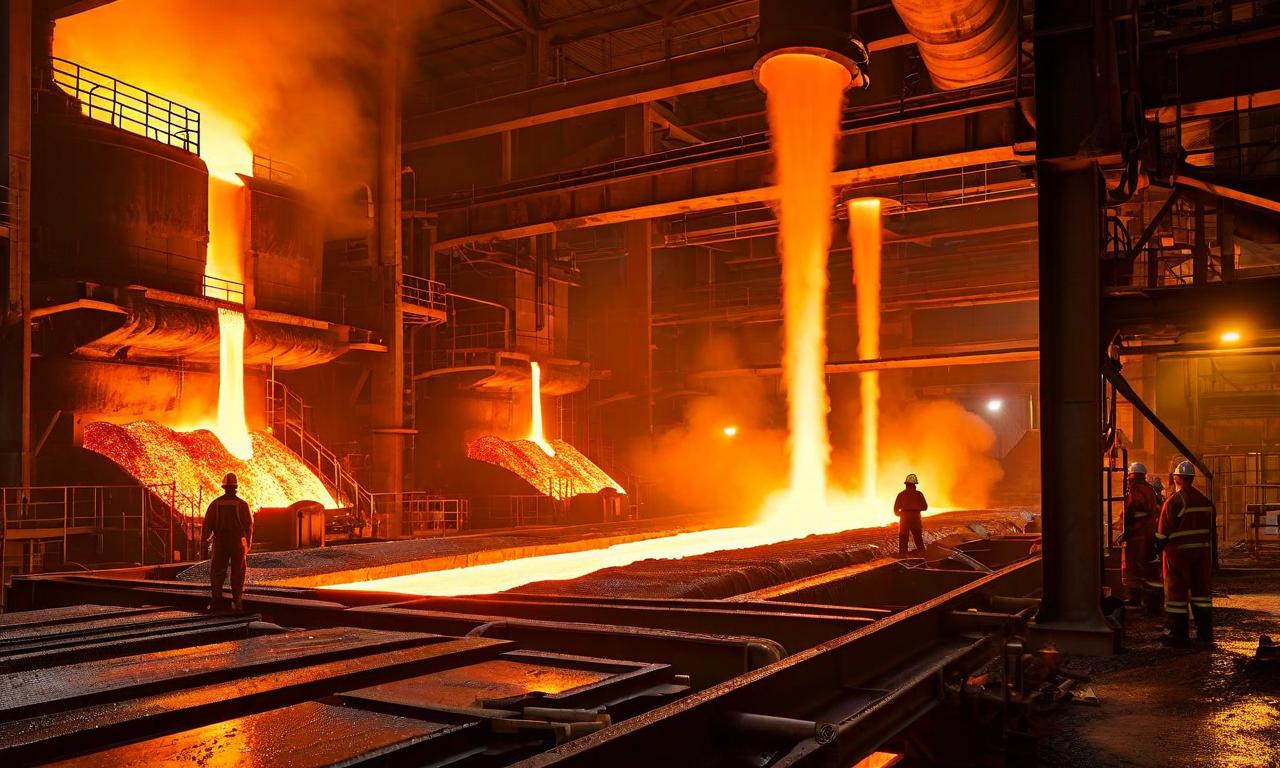
*this image is generated using AI for illustrative purposes only.
Steel Exchange India Limited announced its unaudited standalone financial results for the quarter and nine months ended December 31, 2025. The Board of Directors approved these results at their meeting held on February 14, 2026, following a limited review by the company's statutory auditors.
Financial Performance Overview
The company's financial performance for Q3FY26 shows a significant decline compared to the previous year. Revenue from operations dropped substantially while profitability was severely impacted across both quarterly and nine-month periods.
| Metric | Q3FY26 | Q3FY25 | Change |
|---|---|---|---|
| Revenue from Operations | ₹24,035.05 lakhs | ₹32,750.50 lakhs | -26.60% |
| Total Income | ₹24,085.60 lakhs | ₹32,777.90 lakhs | -26.50% |
| Net Profit | ₹227.90 lakhs | ₹1,586.47 lakhs | -85.60% |
| Earnings per Share (Basic) | ₹0.02 | ₹0.13 | -84.60% |
Nine-Month Performance Analysis
For the nine months ended December 31, 2025, the company demonstrated continued challenges with declining revenue and profitability metrics compared to the corresponding period in the previous year.
| Parameter | 9M FY26 | 9M FY25 | Variance |
|---|---|---|---|
| Revenue from Operations | ₹77,211.24 lakhs | ₹85,260.23 lakhs | -9.40% |
| Total Income | ₹77,871.95 lakhs | ₹85,535.12 lakhs | -9.00% |
| Net Profit | ₹1,462.07 lakhs | ₹2,117.02 lakhs | -30.90% |
| Basic EPS | ₹0.12 | ₹0.18 | -33.30% |
Segment-wise Business Performance
Steel Exchange India operates through two primary business segments: steel production and power generation. Both segments experienced revenue declines during the reporting period.
Steel Business Segment
The steel segment, which includes production and marketing of sponge iron, billets, and rebars (TMT), generated revenue of ₹23,829.54 lakhs in Q3FY26 compared to ₹32,465.89 lakhs in Q3FY25. For the nine-month period, steel segment revenue reached ₹76,000.49 lakhs against ₹83,207.43 lakhs in the previous year.
Power Generation Segment
The power segment, focusing on thermal-based power generation and marketing, contributed ₹2,075.47 lakhs in quarterly revenue compared to ₹3,055.81 lakhs in the corresponding quarter of FY25. Nine-month power segment revenue stood at ₹7,039.92 lakhs versus ₹9,840.40 lakhs in the previous year.
Key Financial Ratios and Metrics
The company's financial health indicators reflect operational challenges and margin compression during the quarter.
| Financial Ratio | Q3FY26 | Q3FY25 |
|---|---|---|
| Debt Equity Ratio | 0.45 | 0.51 |
| Current Ratio | 2.18 | 1.61 |
| Interest Service Coverage Ratio | 1.90 | 2.43 |
| Operating EBITDA Margin | 9% | 12% |
| Net Profit Margin | 1% | 5% |
Corporate Developments
During the quarter, the company undertook several significant financial restructuring activities. Steel Exchange India received ₹3,828 crores worth of 18.75% rated, redeemable, secured Non-Convertible Debentures (NCDs) taken over by Kotak Credit Opportunities Fund on October 7, 2025, with modified terms including a reduced interest rate to 14.06%. Additionally, the company secured a working capital demand loan of ₹1,000 lakhs from Oxyzo Financial Services Limited at an interest rate of 12.00% per annum.
The company also incorporated SEIL Infra Logistics Limited, a wholly-owned subsidiary, on June 29, 2025. As of the reporting date, this subsidiary had not commenced business operations, and consequently, consolidation of its financials was not undertaken for the current quarter.
Source:
Historical Stock Returns for Steel Exchange India
| 1 Day | 5 Days | 1 Month | 6 Months | 1 Year | 5 Years |
|---|---|---|---|---|---|
| +0.66% | -4.31% | -1.21% | +39.43% | +12.24% | +79.41% |
 20
20