Rudra Ecovation Reports Q3FY26 Net Loss of ₹99.09 Lakhs, Revenue Grows 22.06% YoY


Rudra Ecovation Limited announced its Q3FY26 unaudited financial results showing a net loss of ₹99.09 lakhs, representing a 23.05% improvement from the previous year's loss of ₹128.79 lakhs. The textile manufacturer reported revenue from operations of ₹844.14 lakhs, marking a 22.06% year-on-year growth, while maintaining focus on merger proceedings with Shiva Textfabs Ltd.

*this image is generated using AI for illustrative purposes only.
Rudra Ecovation Limited reported its unaudited financial results for the third quarter ended December 31, 2025, showing improved performance compared to the previous year despite continuing losses. The textile manufacturer, formerly known as Himachal Fibres Limited, announced these results following a board meeting held on February 13, 2026, in compliance with Regulation 33 of SEBI (Listing Obligations and Disclosure Requirements) Regulations, 2015.
Financial Performance Overview
The company's financial metrics for Q3FY26 demonstrated mixed results with revenue growth offset by operational challenges:
| Metric | Q3FY26 | Q3FY25 | Change (%) |
|---|---|---|---|
| Revenue from Operations | ₹844.14 lakhs | ₹691.62 lakhs | +22.06% |
| Total Revenue | ₹853.63 lakhs | ₹703.40 lakhs | +21.36% |
| Net Loss | ₹99.09 lakhs | ₹128.79 lakhs | -23.05% |
| Total Comprehensive Loss | ₹96.53 lakhs | ₹126.22 lakhs | -23.51% |
Nine-Month Performance Analysis
For the nine-month period ended December 31, 2025, Rudra Ecovation showed consistent improvement in key financial parameters:
| Parameter | 9M FY26 | 9M FY25 | Variance |
|---|---|---|---|
| Revenue from Operations | ₹2,335.94 lakhs | ₹1,949.30 lakhs | +19.84% |
| Total Revenue | ₹2,383.73 lakhs | ₹2,017.04 lakhs | +18.18% |
| Net Loss | ₹267.79 lakhs | ₹319.83 lakhs | -16.28% |
| Total Expenses | ₹2,661.66 lakhs | ₹2,348.28 lakhs | +13.34% |
Operational Cost Structure
The company's expense breakdown for Q3FY26 revealed significant cost components affecting profitability. Cost of materials consumed stood at ₹498.15 lakhs, representing the largest expense category. Employee benefits expense reached ₹127.39 lakhs, while finance costs decreased to ₹26.93 lakhs from ₹52.62 lakhs in the previous year quarter.
Other operational expenses included depreciation and amortization of ₹29.96 lakhs and other expenses totaling ₹87.48 lakhs. The total expenses for the quarter amounted to ₹956.11 lakhs against total revenue of ₹853.63 lakhs.
Corporate Developments
Rudra Ecovation has filed an application for merger and amalgamation with Shiva Textfabs Ltd. with the National Company Law Tribunal (NCLT) on September 23, 2025. This application remains pending for final order, representing a significant corporate restructuring initiative.
The company also addressed its preference share obligations during the period. Originally, 3,60,000 4% Non-Cumulative Redeemable Preference Shares worth ₹100 each were due for redemption on August 31, 2025. Following approval from preference shareholders through a Special Resolution at an Extraordinary General Meeting held on August 25, 2025, the redemption period has been extended to August 31, 2026.
Regulatory Compliance and Business Operations
The financial results were prepared in accordance with Indian Accounting Standards prescribed under section 133 of the Companies Act, 2013, based on recommendations of the Audit Committee. The complete financial results along with the Limited Review Report are available on stock exchange websites and the company's official website.
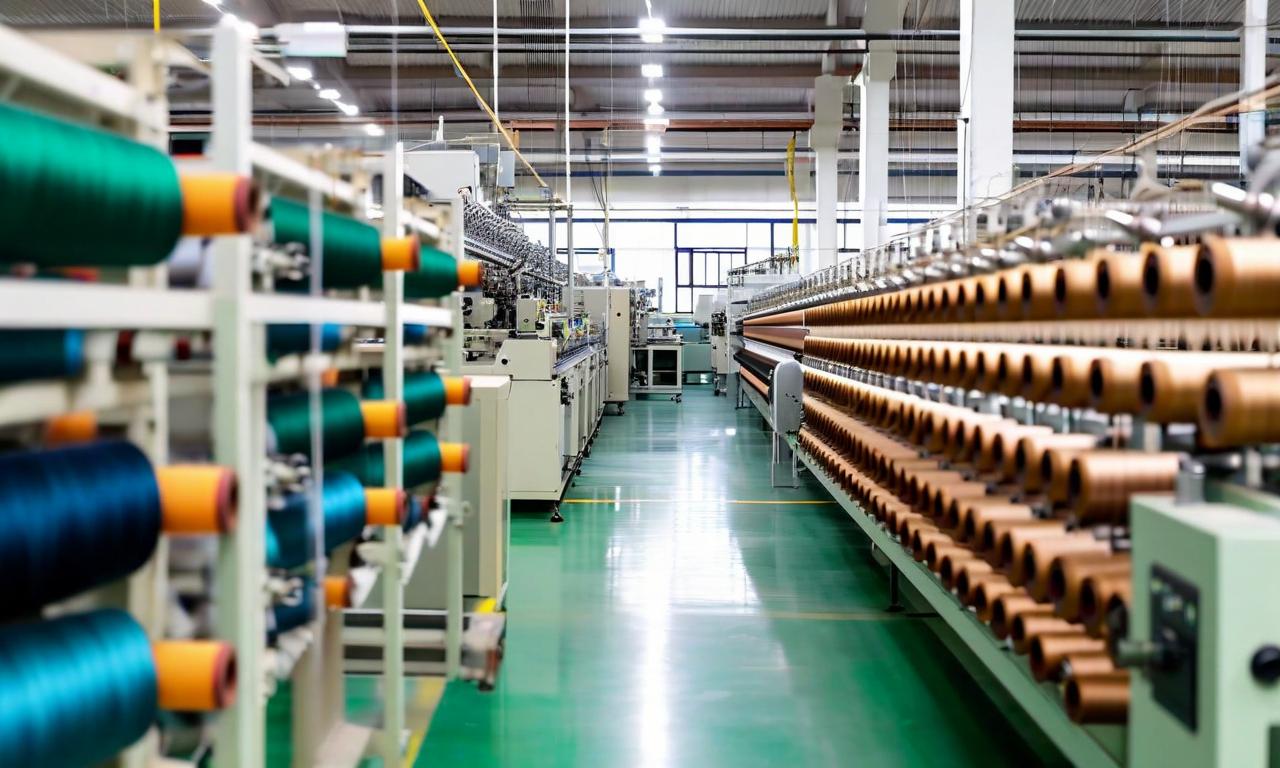
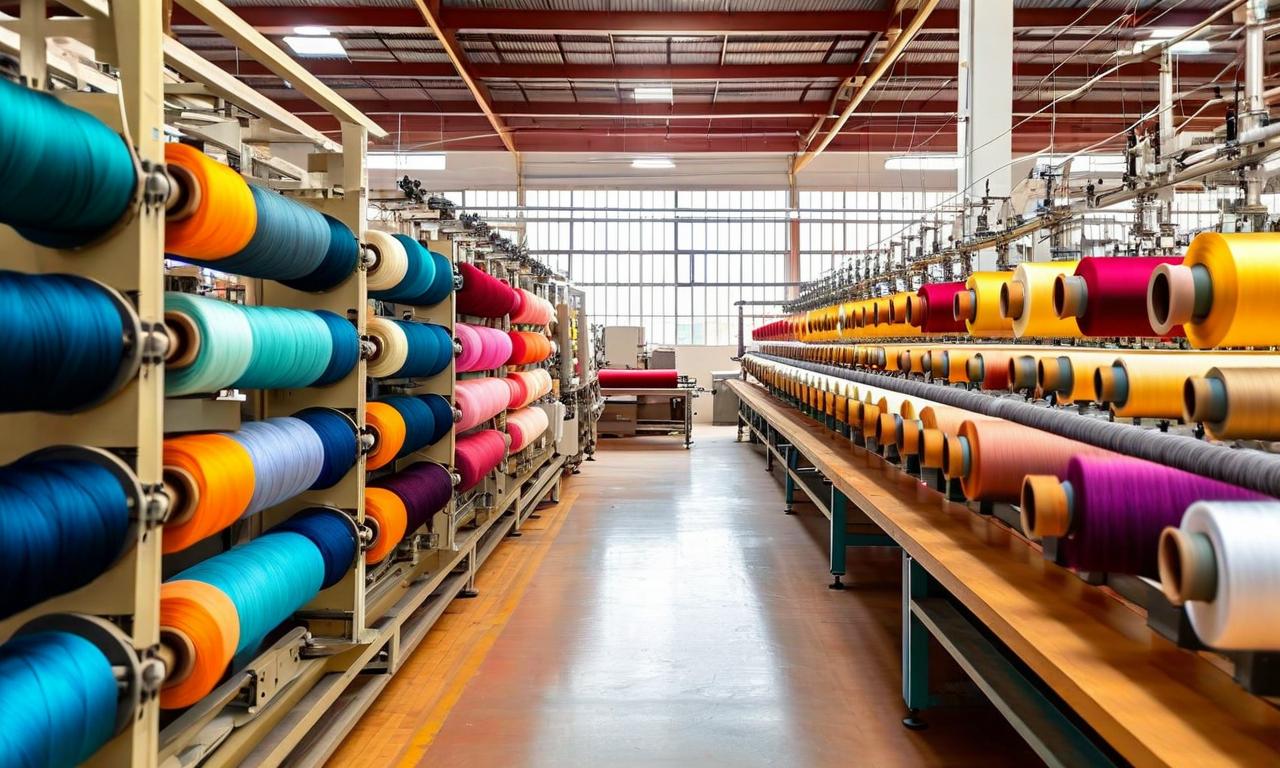
Rudra Ecovation operates primarily in the textile manufacturing sector, focusing on yarns and fabrics production. The company operates as a single business segment, eliminating the need for segment reporting under Ind AS 108 'Operating Segments'. The earnings per share for Q3FY26 stood at ₹(0.08) on both basic and diluted basis, compared to ₹(0.12) in the corresponding quarter of the previous year.
Historical Stock Returns for Rudra Ecovation
| 1 Day | 5 Days | 1 Month | 6 Months | 1 Year | 5 Years |
|---|---|---|---|---|---|
| 0.0% | +5.21% | -11.63% | -17.18% | -56.40% | +441.34% |
 16
16