Pondy Oxides Reports Record Q3FY26 Performance with 149% Net Profit Growth


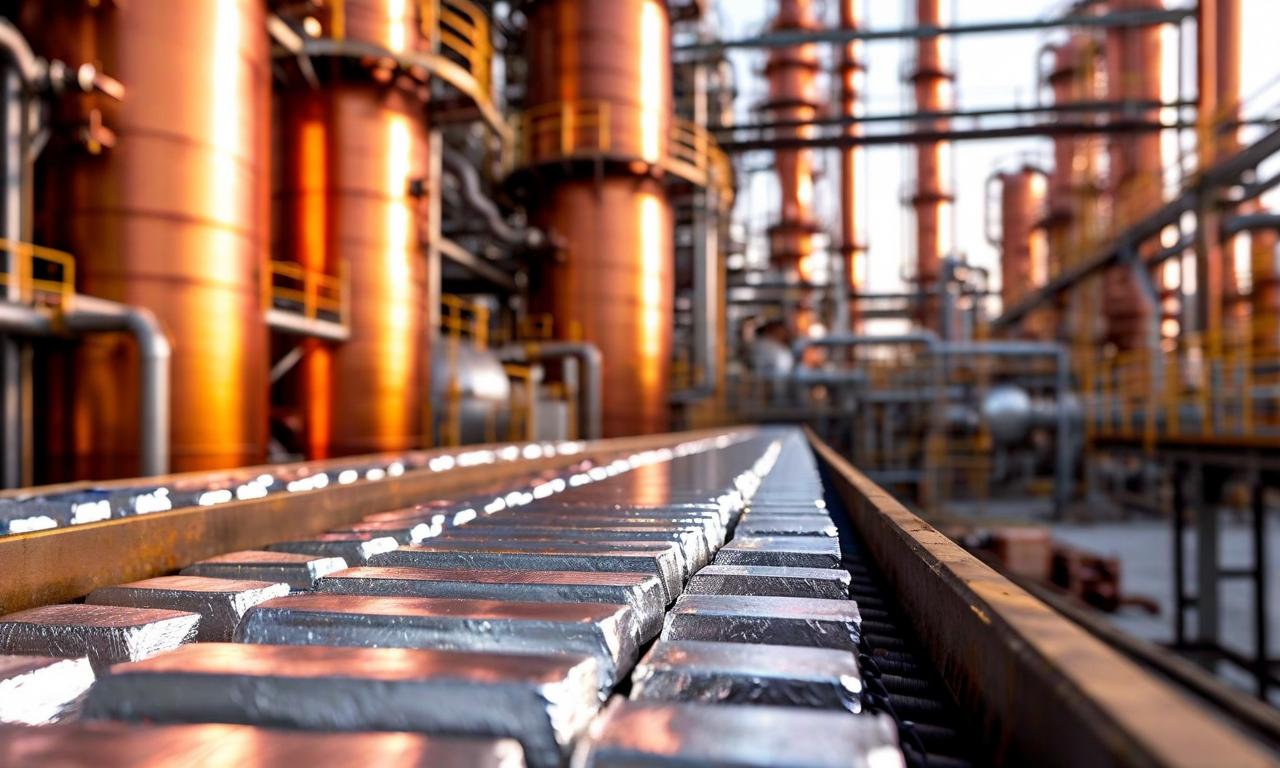
Pondy Oxides & Chemical achieved its strongest quarterly performance in Q3FY26 with net profit surging 149% to ₹376 million and revenue growing 55% to ₹776 crores. The company expanded lead capacity by over 50% to 204,000 metric tons per annum and is doubling copper capacity to 12,000 metric tons, with exports contributing 67% of revenue and value-added products representing 65% of lead segment sales.

*this image is generated using AI for illustrative purposes only.
Pondy Oxides & Chemical has delivered its strongest ever quarterly performance in Q3FY26, demonstrating exceptional growth across all key financial metrics. The company held its earnings conference call on January 29, 2026, where management highlighted record-breaking results driven by disciplined execution and operational efficiency improvements.
Outstanding Financial Performance
The company achieved remarkable financial results for the third quarter, with substantial improvements in both revenue and profitability metrics. The performance reflects strong operational management and effective capacity utilization across business segments.
| Financial Metric | Q3FY26 | Q3FY25 | Growth (%) |
|---|---|---|---|
| Net Profit | ₹376 million | ₹151 million | +149% |
| Revenue | ₹776 crores | ₹500 crores | +55% |
| EBITDA | ₹59 crores | ₹27 crores | +122% |
| EBITDA Margin | 7.6% | 5.4% | +220 bps |
Nine-Month Performance Highlights
On a nine-month basis, the company demonstrated consistent growth momentum with revenue, EBITDA, and PAT increasing by 33%, 96%, and 114% year-on-year respectively. Total nine-month revenue reached ₹2,007 crores, supported by substantial growth in production and sales volumes across lead and copper business segments.
| Nine-Month Metrics | FY26 | FY25 | Growth (%) |
|---|---|---|---|
| Revenue | ₹2,007 crores | ₹1,508 crores | +33% |
| EBITDA | ₹157 crores | ₹80 crores | +96% |
| PAT | ₹101 crores | ₹47 crores | +114% |
Operational Excellence and Capacity Expansion
The company commissioned its second phase lead expansion project in December 2025, adding 36,000 metric tons per annum capacity. Total lead capacity increased from 132,000 metric tons per annum in FY25 to 204,000 metric tons per annum, representing over 50% growth. Lead production increased by 57% year-on-year to 33,271 metric tons in Q3, with EBITDA per ton reaching ₹17,427.
Strategic Business Developments
Export sales contributed 67% of total revenue, reflecting the company's growing global presence and customer confidence. Value-added products accounted for 65% of lead segment revenue on a nine-month basis, supporting the long-term target of achieving over 60% contribution from value-added products. The copper recycling capacity is set to double from 6,000 metric tons per annum to 12,000 metric tons per annum by end of January 2026.
Future Growth Outlook
Management remains aligned with its Target 2030 vision, focusing on delivering 20% plus volume growth and maintaining EBITDA margins above 8%. The company plans to expand into adjacent non-ferrous segments while targeting over 60% revenue contribution from value-added products and 20% plus reduction in energy consumption.
Historical Stock Returns for Pondy Oxides & Chemical
| 1 Day | 5 Days | 1 Month | 6 Months | 1 Year | 5 Years |
|---|---|---|---|---|---|
| +0.84% | +1.17% | +18.26% | +5.45% | +54.83% | +746.14% |
 19
19